Hi Kim,
I’m sorry I did not look at this in more detail when you first posted (I was preparing to move from the US back to Aus, so have been a bit distracted).
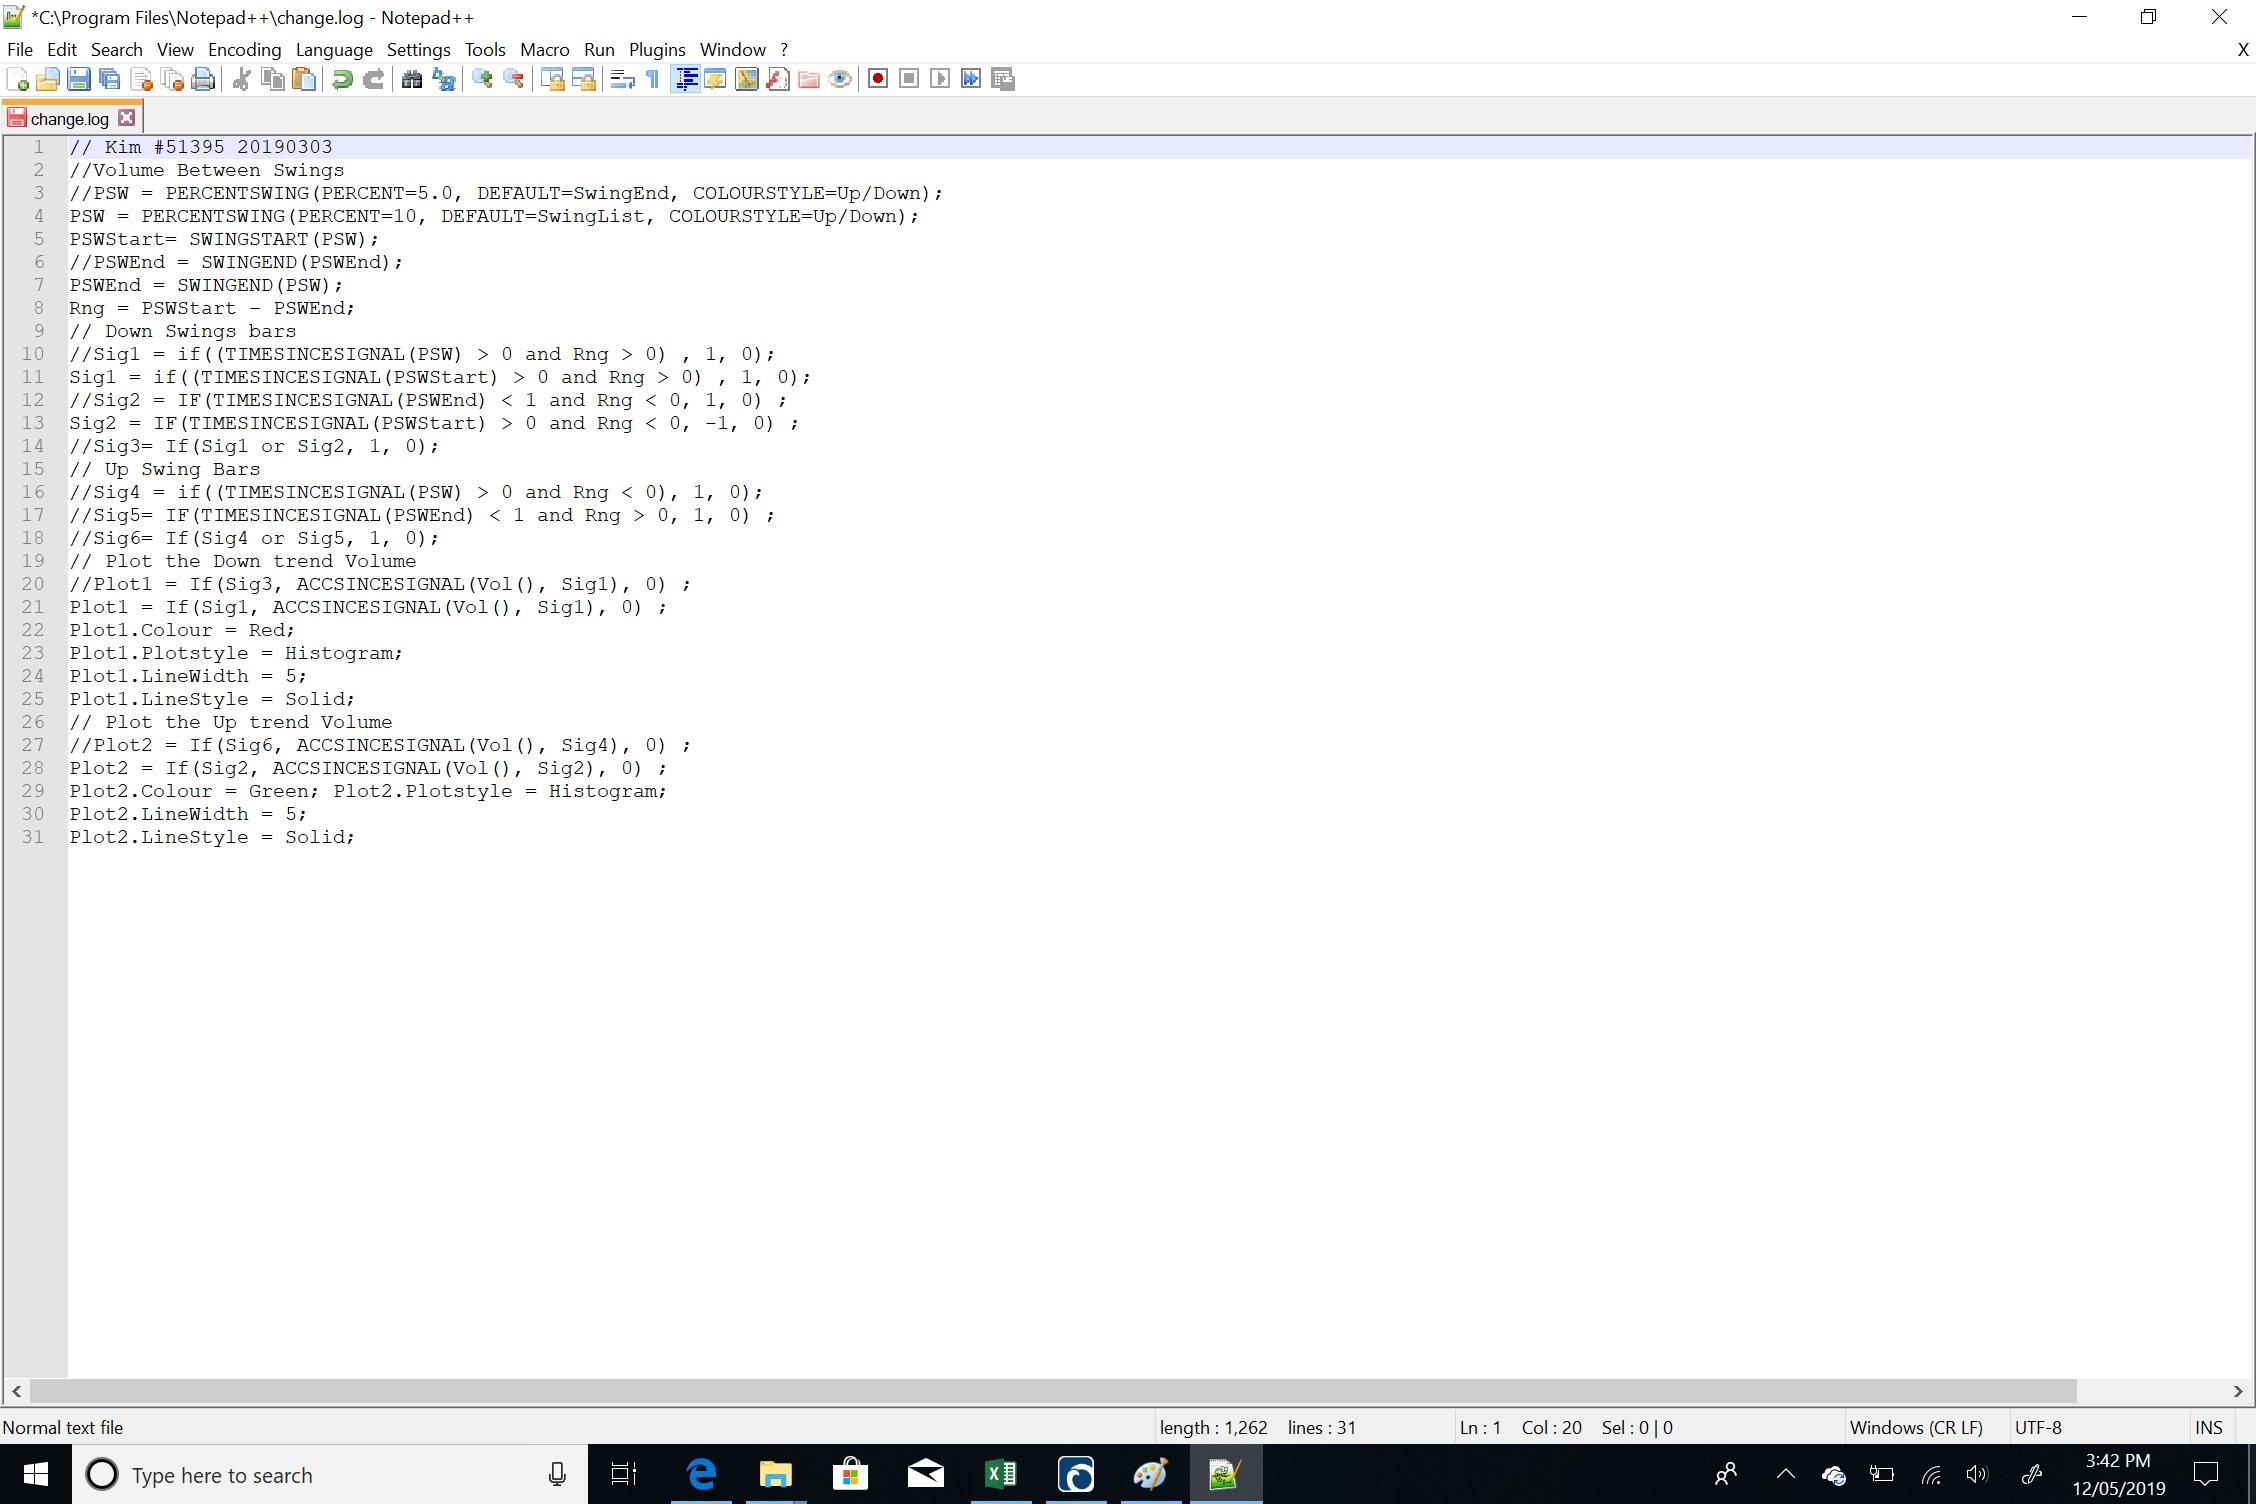
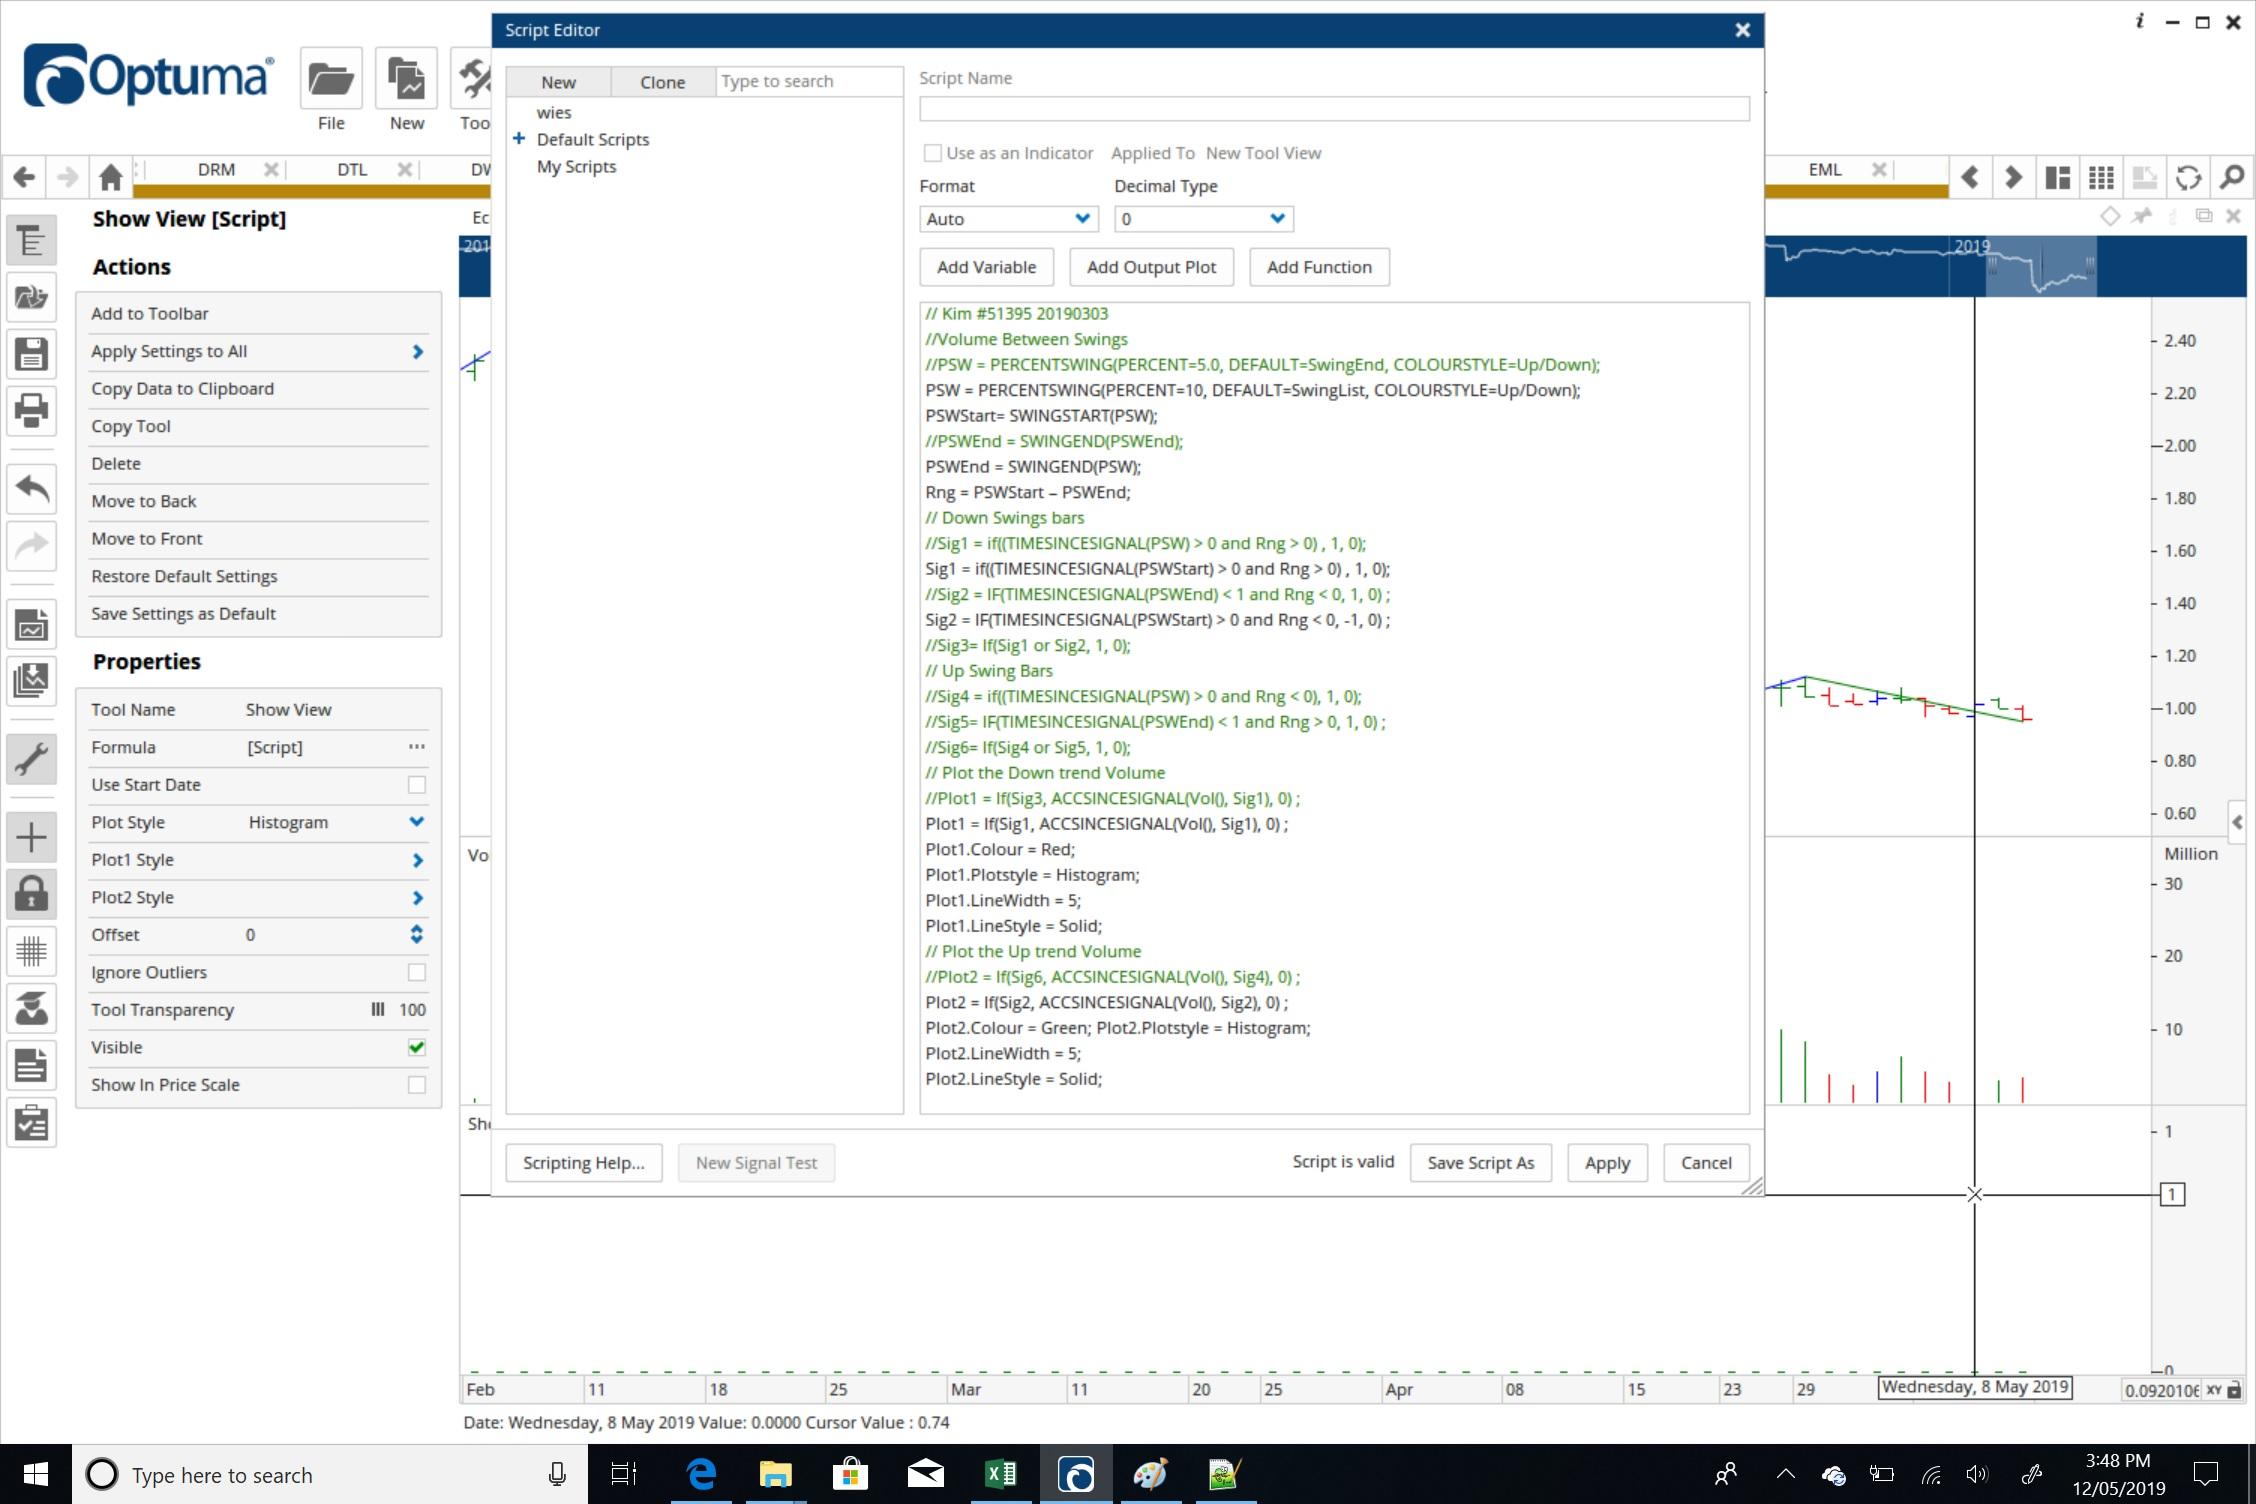
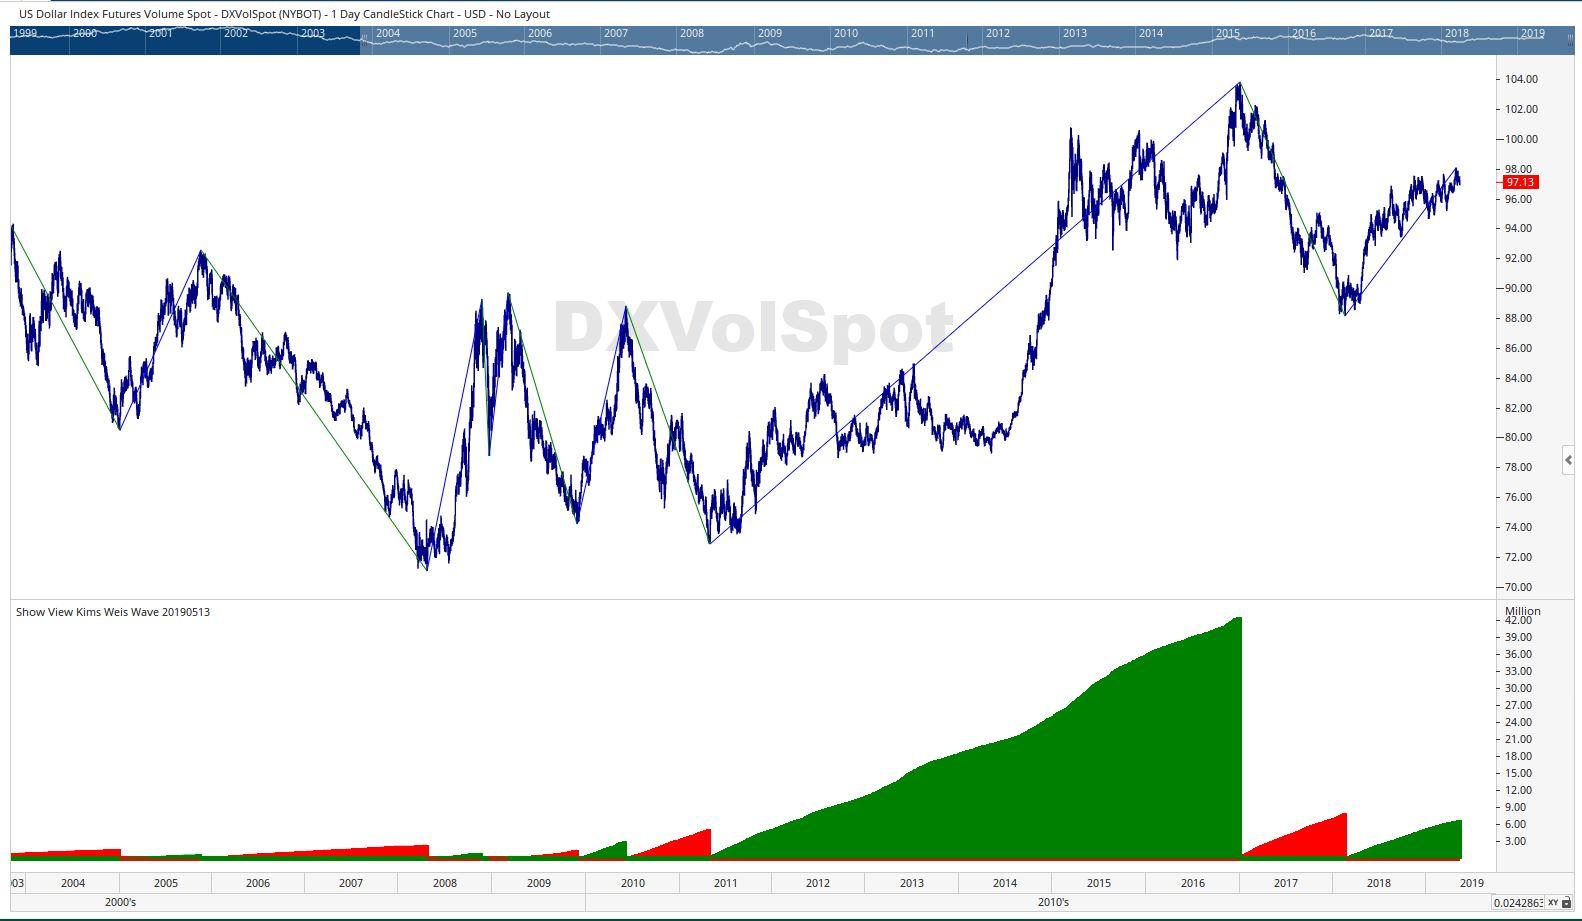
For reference, here is some code to do the Weis Waves.
// is this close higer than previous close
vUp = CLOSE() >= CLOSE()[1];

// remember that true = 1 and false = 0
vUpSig = vUp ChangeTo 1;
vDnSig = vUp ChangeTo 0;

// Plot the Down trend Volume
Plot1 = If(vUp == 0, ACCSINCESIGNAL(Vol(), vDnSig), 0) ;
Plot1.Colour = Red;
Plot1.Plotstyle = Histogram;
Plot1.LineWidth = 5;
Plot1.LineStyle = Solid;

// Plot the Down trend Volume
Plot2 = If(vUp == 1, ACCSINCESIGNAL(Vol(), vUpSig), 0) ;
Plot2.Colour = Green;
Plot2.Plotstyle = Histogram;
Plot2.LineWidth = 5;
Plot2.LineStyle = Solid;
To Trevor’s point above - make sure you use the “<> Code” button in the forum toolbar to insert code. That avoids the text editing changing characters.
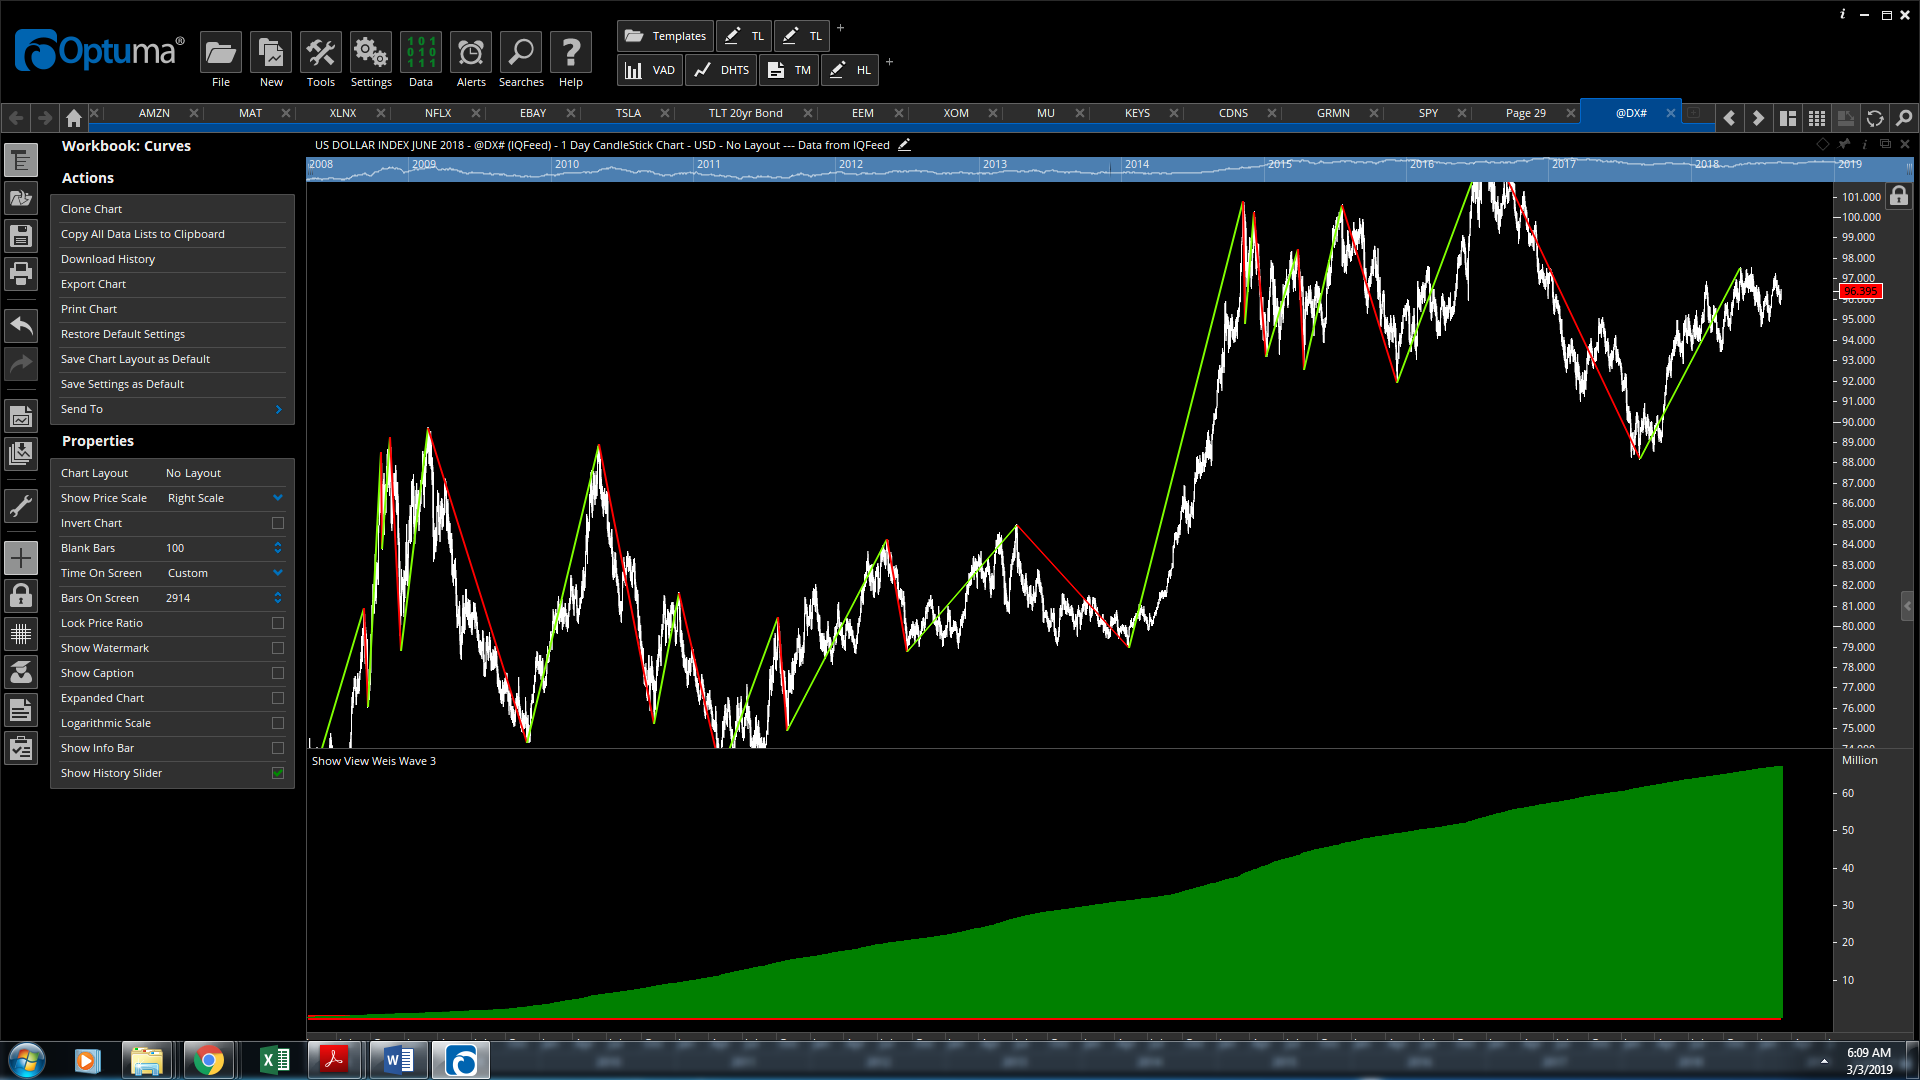
Now, to the idea of a Gann version of this, I would strongly caution against using swing charts for this. The issue is the lag from the swing bottom until we know it was a bottom. We could use the confirm dates of the swings (when we knew the swing had changed - change the colour style to “Unconfirmed” and you will see the difference this makes) but that will apply an offset to the interval for which the volume is being accumulated.
We also need to couple this with the fact that volume typically fades as the trend continues. So if we delay we are missing the major volume at the start of the swing.
So we have two choices:
- We accumulate from swing bottom to swing top.
- We accumulate from confirmation date to confirmation date.
This all gets much more complex when we are working with swings. Make sure you have a look at this post
https://www.optuma.com/swing-scripting-1/
Put this script in a Show Plot
GS = GANNSWING(DEFAULT=SwingList, USECLUSTERS=False, USEBREAKOUT=False, SWINGCOUNT=2);
GS.SwingEnd
And compare that with this version
GS = GANNSWING(DEFAULT=SwingList, USECLUSTERS=False, USEBREAKOUT=False, SWINGCOUNT=2);
SWINGEND(GS)
The second one is giving us the flat lines at the extremes of the swings.
Ok, enough blabbing - here is a script that will do what you are looking for (subject to all the caveats above).
// Is our swing up
GS = GANNSWING(DEFAULT=SwingList, USECLUSTERS=False, USEBREAKOUT=False, SWINGCOUNT=2);
// close() > 0 is a hack we use to convert from swings to bars
vUp = SwingUp(GS)  and (Close() > 0);

// when does the swing turn
vUpSig = vUp ChangeTo 1;
vDnSig = vUp ChangeTo 0;

// Plot the Down trend Volume
Plot1 = If(vUp == 0, ACCSINCESIGNAL(Vol(), vDnSig), 0) ;
Plot1.Colour = Red;
Plot1.Plotstyle = Histogram;
Plot1.LineWidth = 5;
Plot1.LineStyle = Solid;

// Plot the Down trend Volume
Plot2 = If(vUp == 1, ACCSINCESIGNAL(Vol(), vUpSig), 0) ;
Plot2.Colour = Green;
Plot2.Plotstyle = Histogram;
Plot2.LineWidth = 5;
Plot2.LineStyle = Solid;
Hope that helps
Mathew