I tried to create the 50% All Time High / All Time Range as shown above but it won’t work. Is it supposed to be written exactly as shown above. As soon as I type in P2 there is a message in red at the bottom saying please enter a valid script to add to this criteria. BELOW IS HOW I HAVE WRITTEN THE SCRIPT.
Sorry - I will update this so everyone can understand.
For this process you will be using 2 tools, both tools are to be setup with the exact same script.
So you will have 2x setup of Show Plot and 2x setup of Chart Element to achieve both of these scripts in action. It might be good to color code these different colors.
– Show Plot
– Chart Element
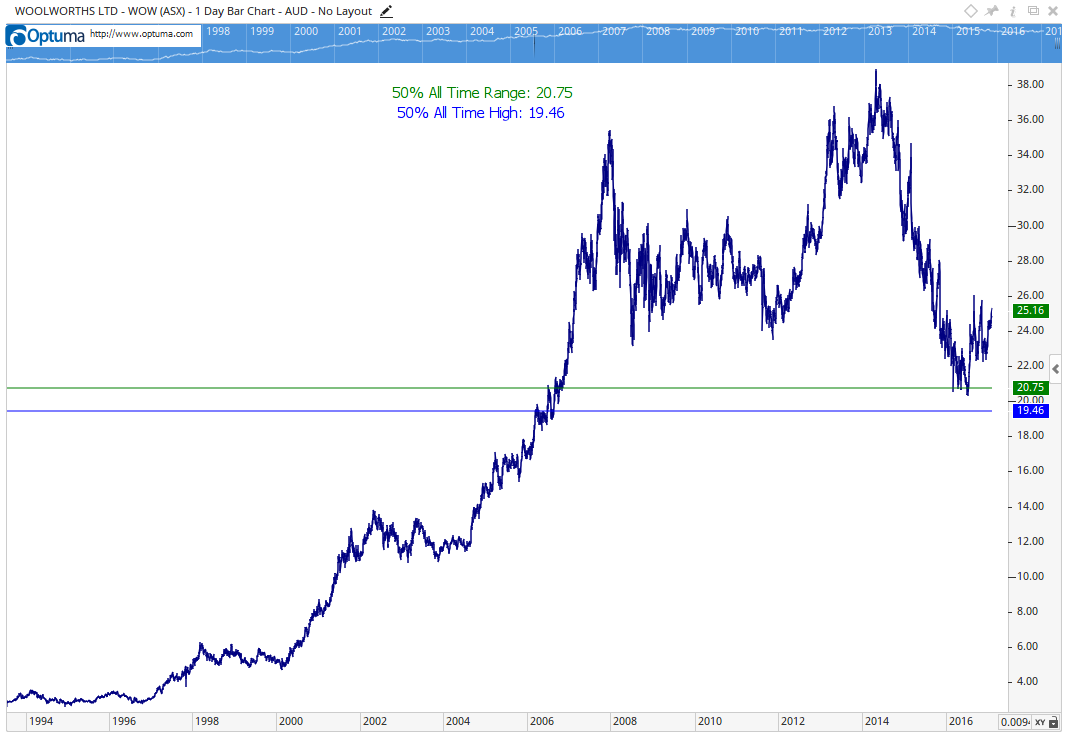
//To script the '50% All Time Range' use;
P1 = LOWESTLOW(RANGE=All Time) ;
P2 = HIGHESTHIGH(RANGE=All Time) ;
(P1 + P2) / 2
I have written the two scripts separately and they show up separately as 50% All Time High and 50% All time range under My Scripts in the script editor. Then when I open a chart, I open the tools and go to chart element it brings up the code. I right click to edit the field and to bring up the script I can only get 50 % of all time high.
I can bring up the plot for both scripts but cannot edit the name of the script . Also if, when I lock the time/price in the element screen does that actually lock the time/price in the scripts?
That would be 50% of the range, so if the high was 100 and the low was 20 half the range would be 80/2 = 40. But 40 is not halfway between the high and low - you need to add it to the low to get the midpoint of the H-L range, ie 20+40 = 60.
Instead it would be much easier to use (H + L)/2 = 60. See Jonathan’s earlier post above.
To calculate X% of a range you need to subtract the low from the high and multiply by the %, and then add the result to the low. So for 38.2% of the all-time range:
//Get Lowest Low;
P1=LOWESTLOW(RANGE=All Time);
//Get Highest High;
P2=HIGHESTHIGH(RANGE=All Time);
//Calculate range and multiply by %;
R1=(P2-P1)*0.382;
//Add to Lowest Low
P1+R1
To add multiple % ranges to one Show Plot, eg 38.2% and 61.8%:
//Get Lowest Low;
P1=LOWESTLOW(RANGE=All Time);
//Get Highest High;
P2=HIGHESTHIGH(RANGE=All Time);
//Calculate range and multiply by %;
R1=(P2-P1)*0.382;
R2=(P2-P1)*0.618;
//Add to Lowest Low
Plot1=P1+R1;
Plot2=P1+R2;