An ATR on one security can not be compared with another. The only way we can compare the volatility of different securities is to calculate the percentage of the ATR compared to the price of the security. This script represents that ATR ratio as a percentage.
Hey Mathew, any way to then take the ATR % and build historical range bars based on that?
For instance I would like to use Range bars set at a trailing x days ATR% . Is there a way to do this (price charts would be built backwards from today)?
As example I would like the SPY Range bars instead of being a set 2.5%, instead be a dynamic range based on that day’s trailing 10 day ATR %. So this would be the input into the “Range Value” on the Range Charts. Or very well could just be the ATR $ itself and the “Range Value - Price” could be used.
I can’t see that using today’s ATR values and working back would work. The ATR today is going to be much bigger and it would render earlier values to be really really small. There is no way for us to build a bar from three different values. It would require a bit of work to add that in.
What you could do is use three plots of the above script but for the other two change the “Close()” to the “high()” and “low()” (do this in a Show View). Then what you would have is a line for the high price as a percentage of ATR for that day, and also the close line and the low line.
You may need to play with the order of this - I just realised that the high would be smaller than the low -but that could still be the information you need to know.
Translated by Google:
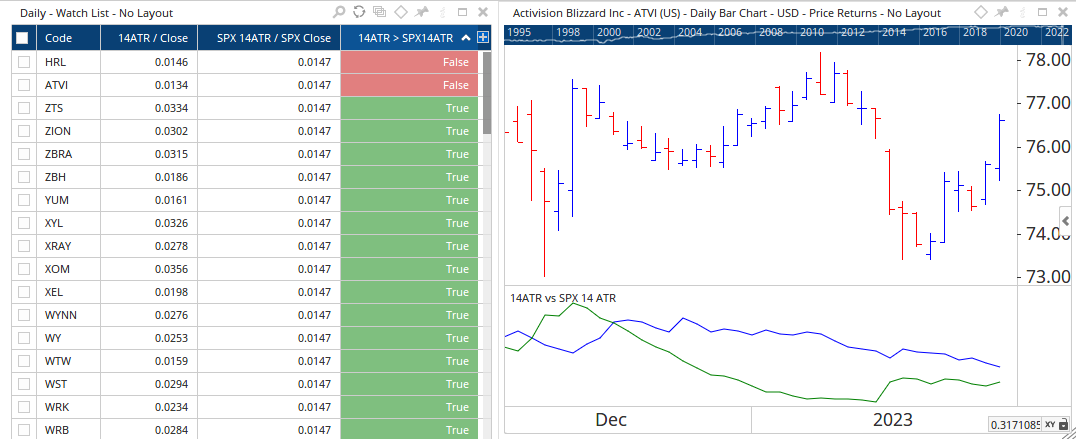
Suppose I create a watchlist of the SP500 and use the following code:
(ATR(BARS=14, MULT=1.00) / CLOSE() ) > #value : 0.05
then a list neatly rolls out with true/false.
But now I want to replace the value 0.05 with the value of the ATR percentage by the ATR value calculated from the SP500 index.
In the example above I always have to calculate that value 0.05 and then enter it.
How can I indicate in the formula that the value (0.05 in the example above) should be calculated from the SP500 index,
so that I can enter that in the formula:
(ATR(BARS=14, MULT=1.00) / CLOSE() ) > (ATR calculated from the SP500 index that day)
so that the value is recalculated every day and does not have to be entered manually.