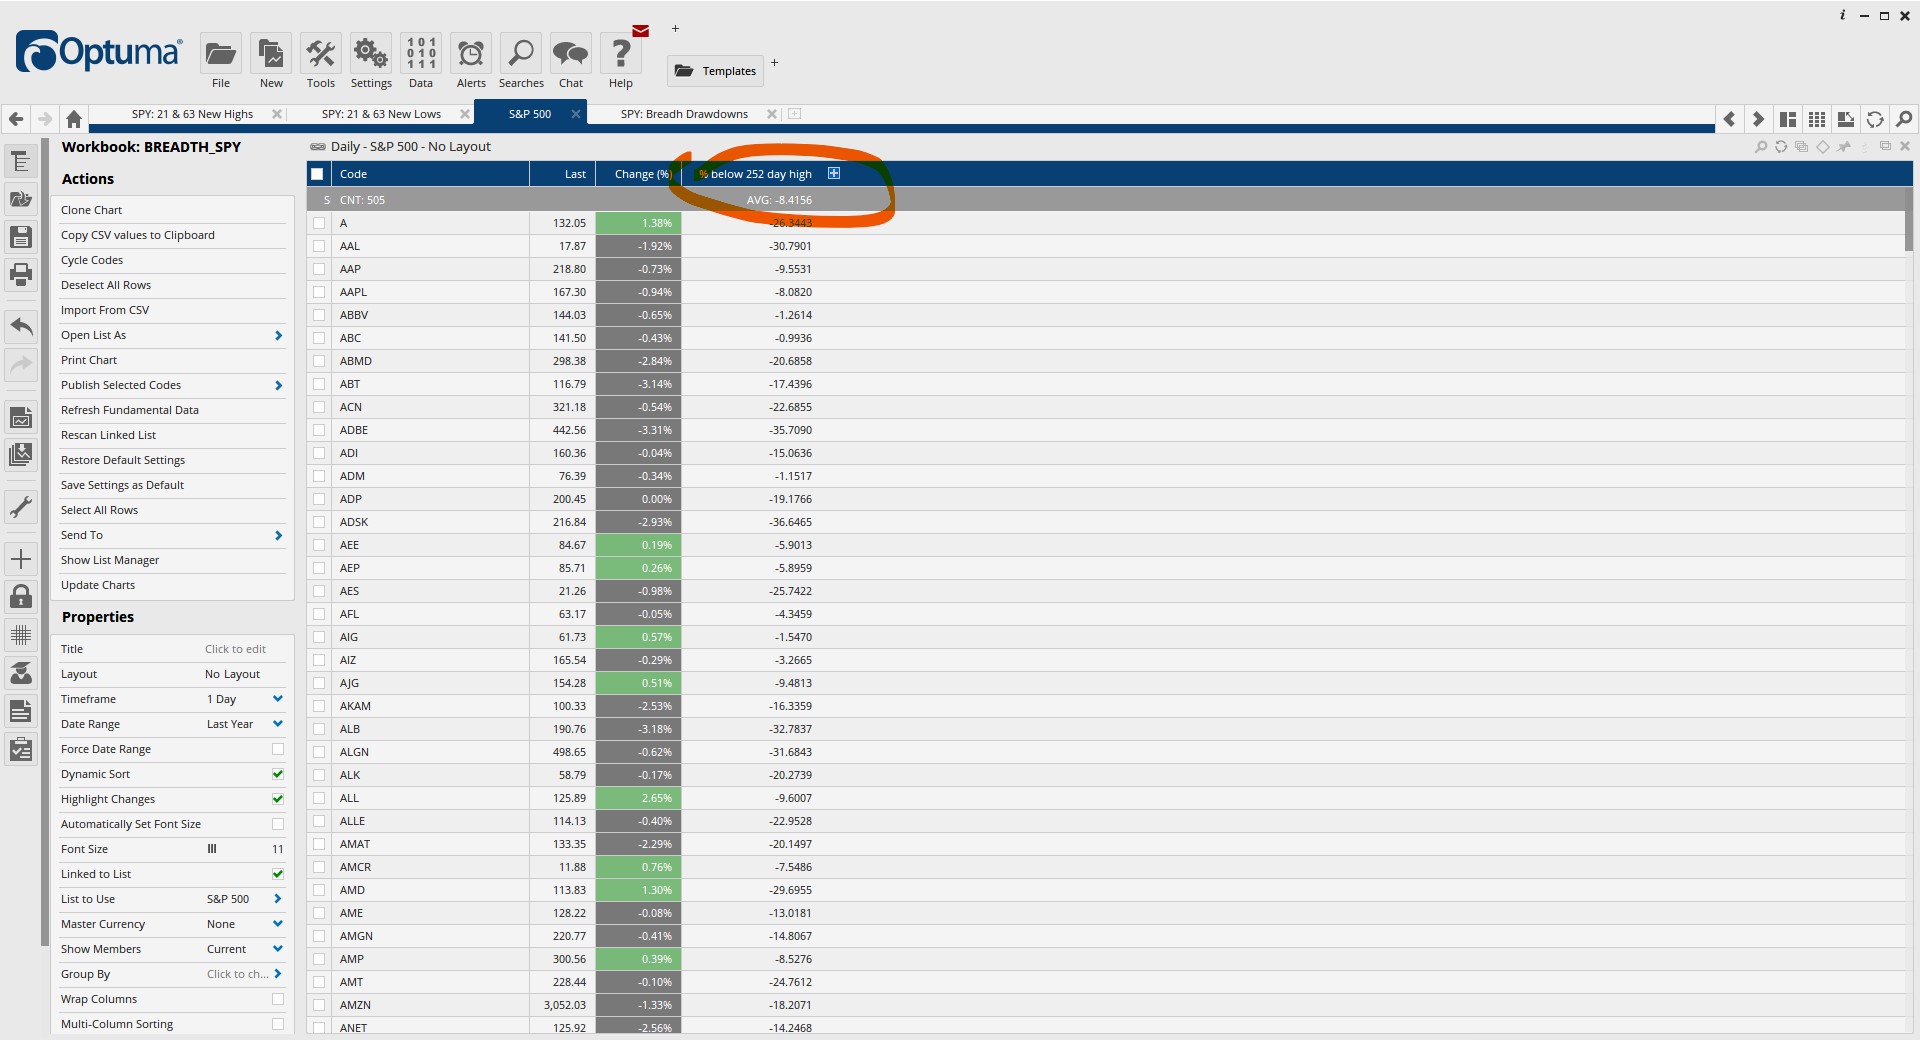
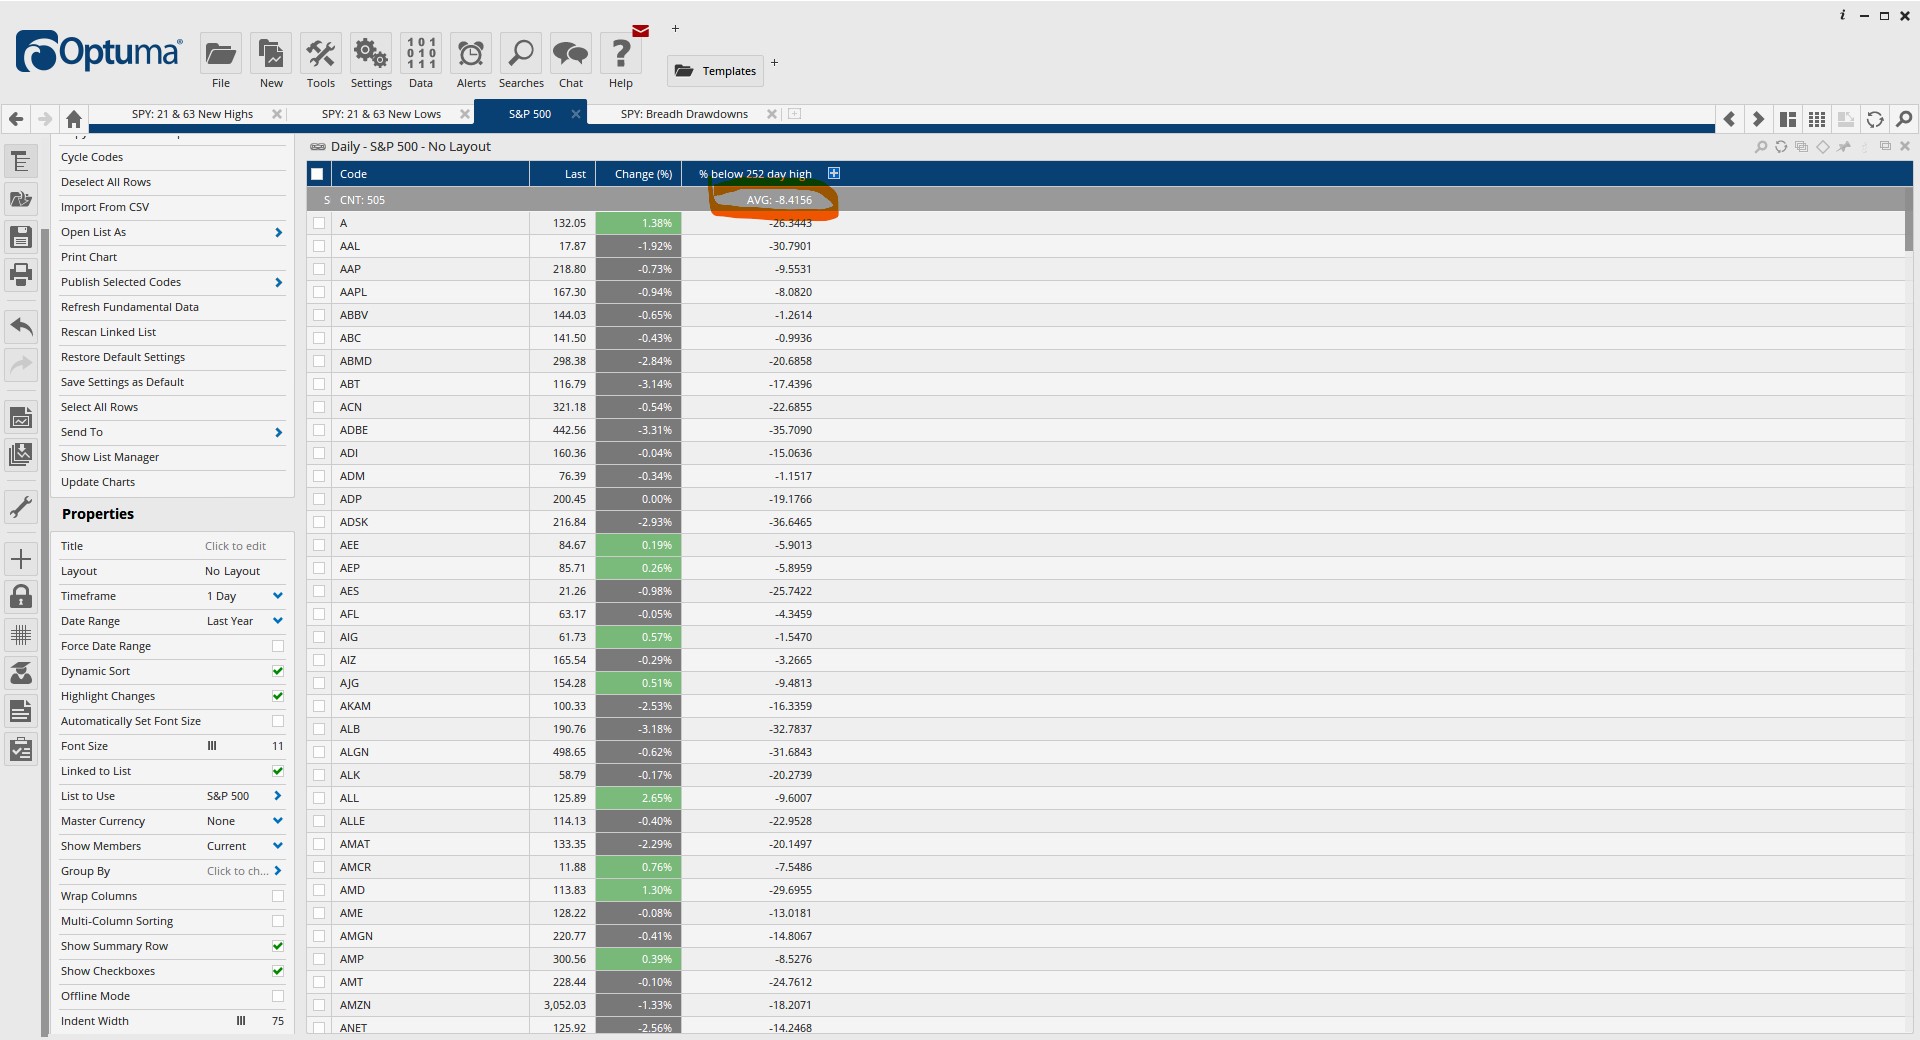
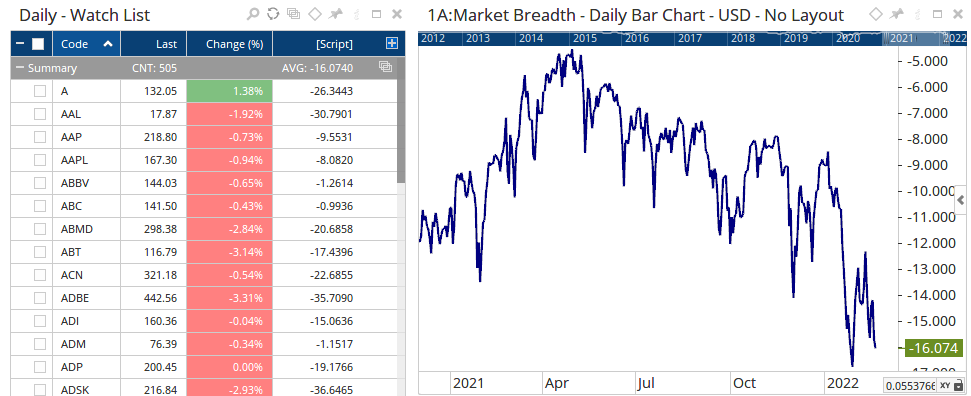
In the watch list summary row, I selected average above this script column. This is showing the average of all of the 505 stocks are below their 252-day closing highs. Please see attached picture 1.
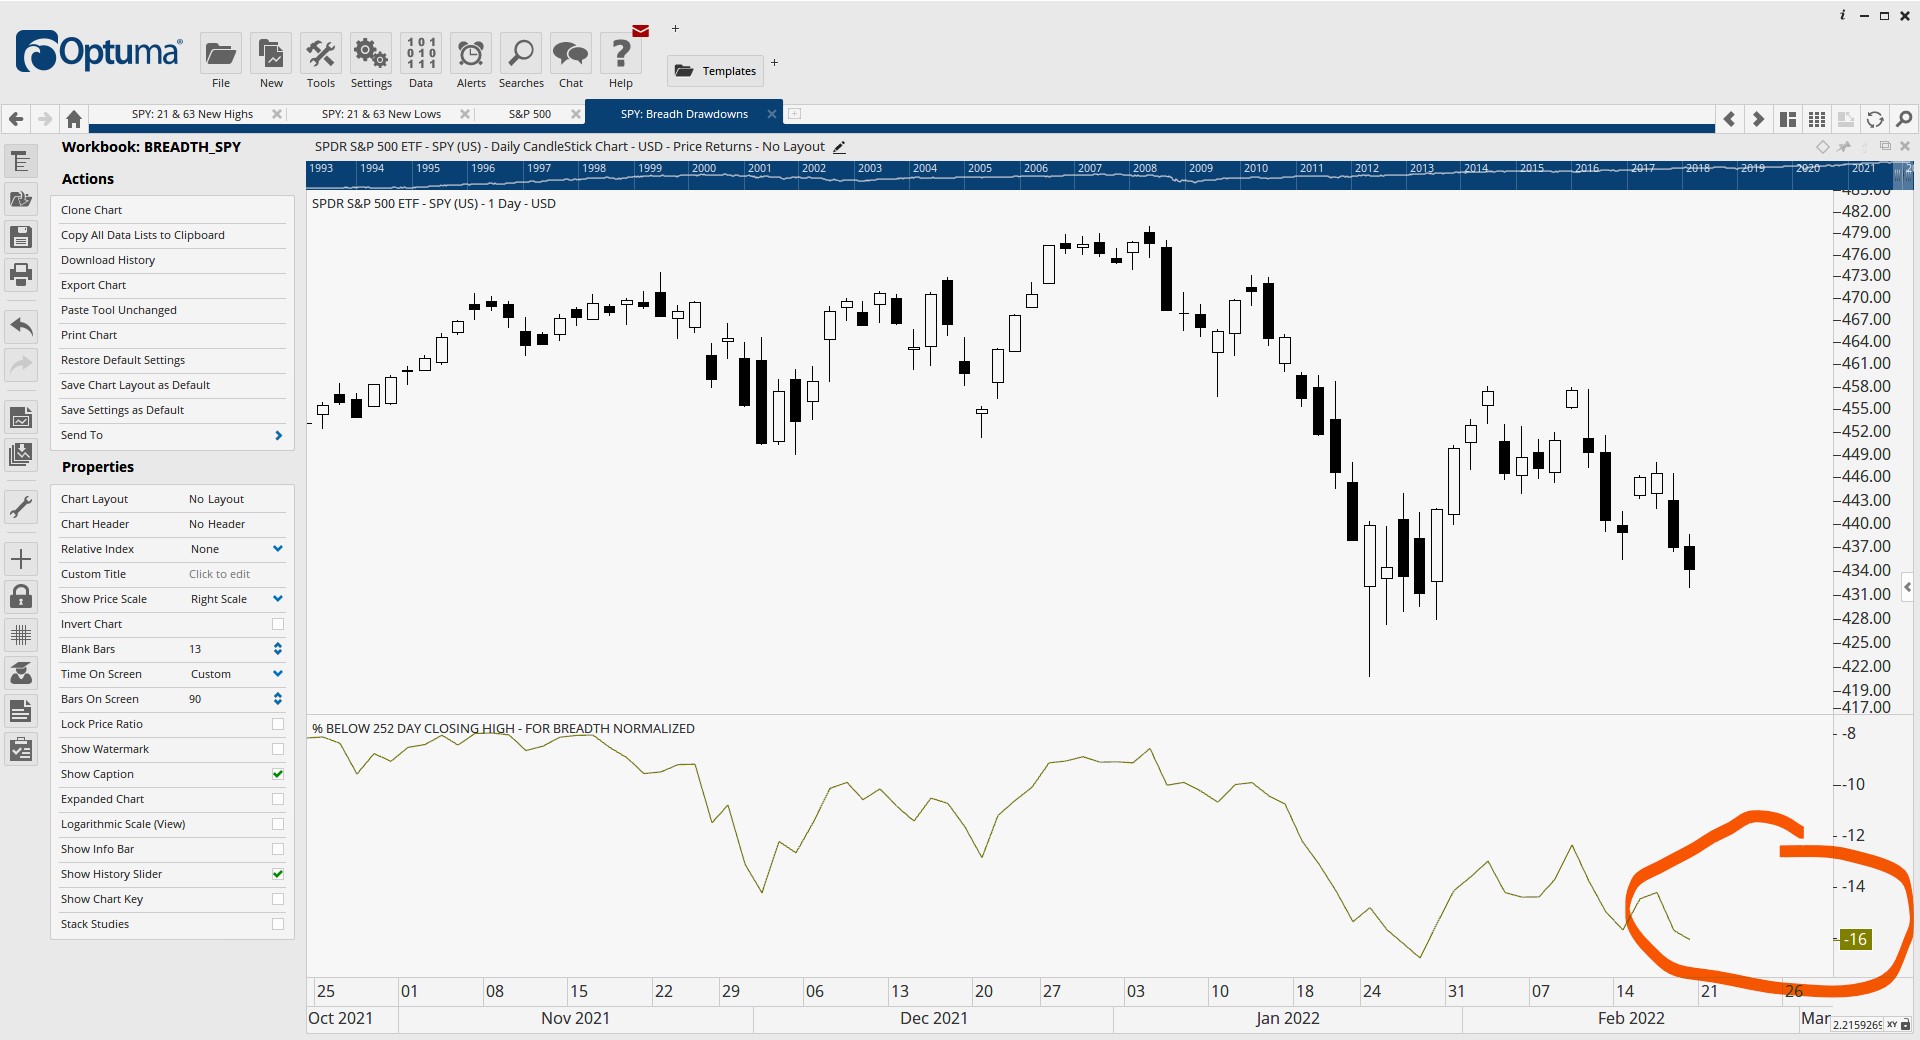
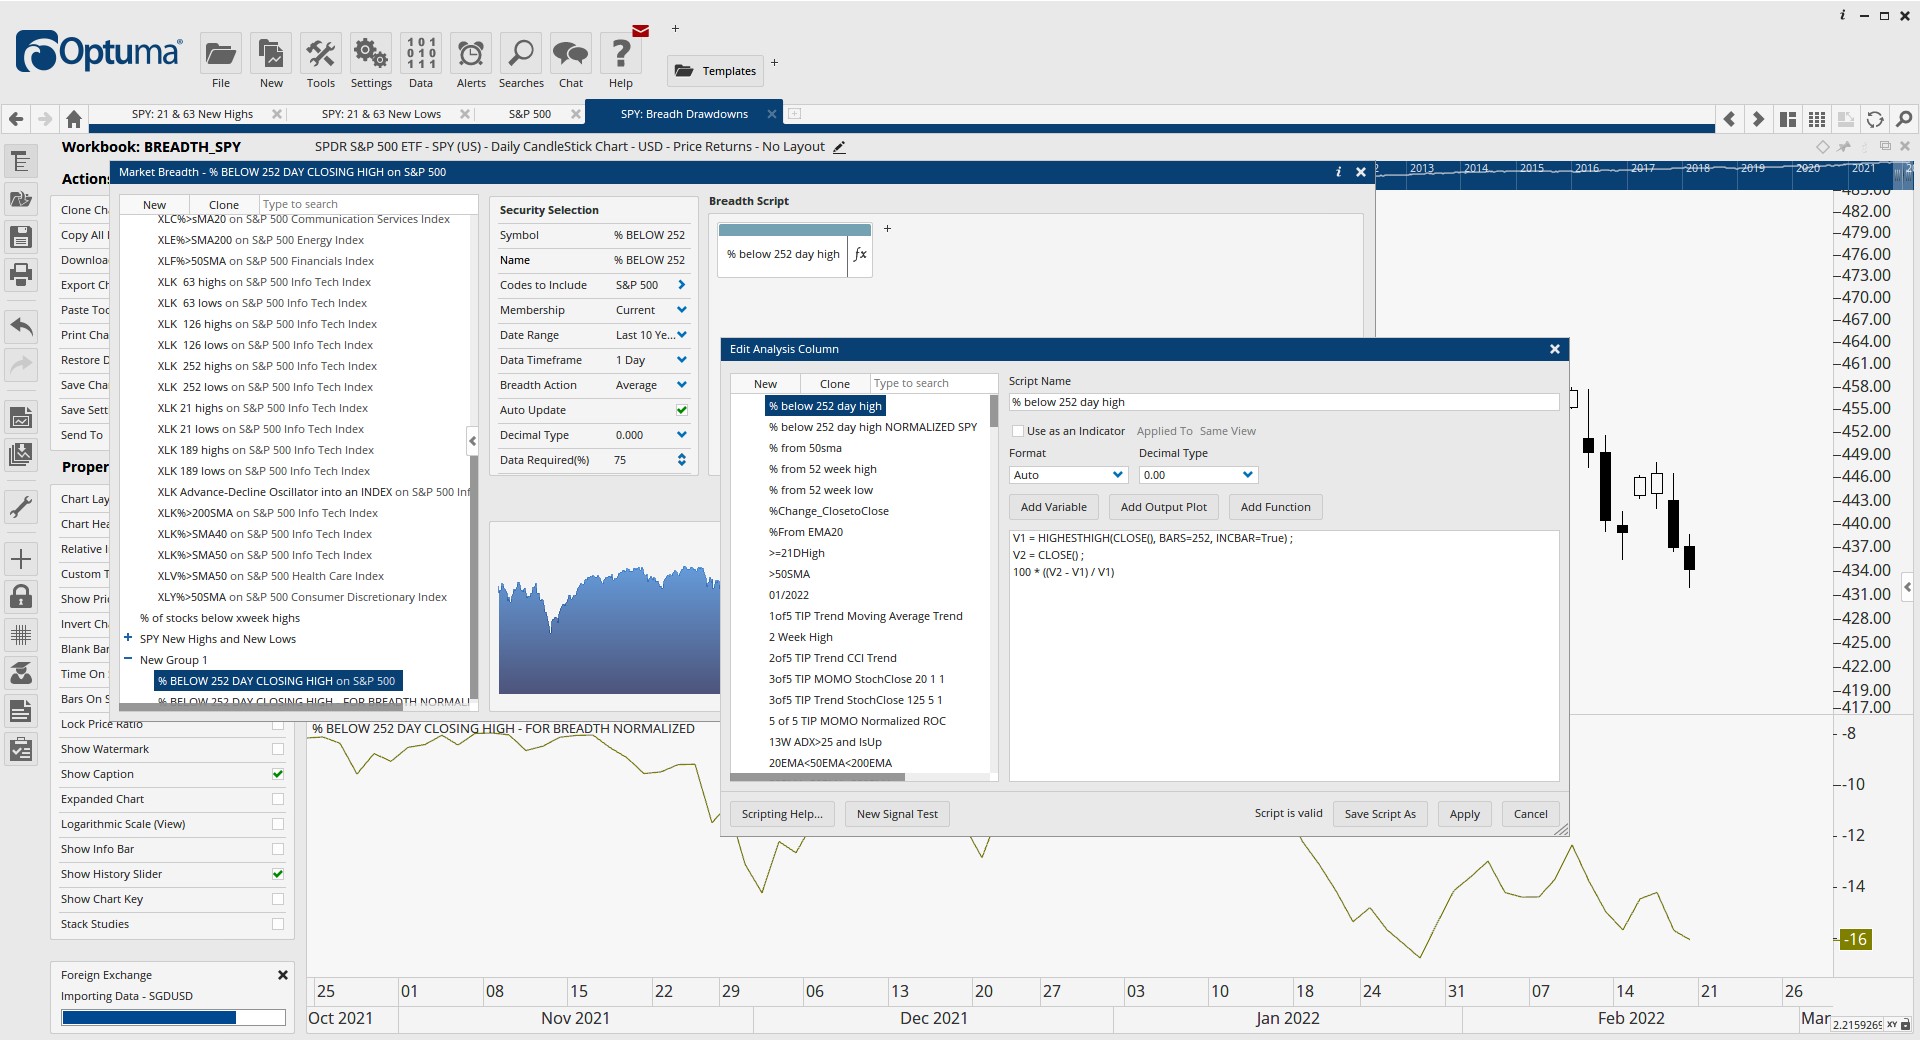
I want to plot this average value, the average that all stocks are below their 252-day highs, in a breadth tool. I cannot figure out the correct script. I set the breadth action setting to sum and tried to normalize the formula but it doesn’t match the watchlist value:
Hi Matthew. This is what I tried originally, but the values do not match.
The value from the watchlist is 8.41%.
The value from the breadth tool is 16%.
This discrepancy is because in the breadth engine, the average setting divides the result of the script by the total amount of items being checked. 8.41/505 = 16. Please see pictures 1, 2 and 3 attached.
I can’t work out how you’ve produced a value of -8.41 on the WL summary. When I use the same script between Breadth and WL Average, the values both show -16.074.
Thank you. You workbook looks great. I went back and crated a new watchlist and the average changed to the 16% value. Not sure why this happened, but you saw the picture. I did not change the script, just started a new watchlist.
I am very happy this is now working properly. I am just a little confused. The knowledge base says: “Average - Based on the Sum above, this one divides the result by the total number of members to get an average each day.” https://help.optuma.com/kb/faq.php?id=644. When does this setting perform the division?
Glad it’s working now. Not sure where the other value came from, I went through all the options, only thing i can think is it calculated before an EOD update had finished so it was incomplete data, i will need to test further to see if i can replicate.
For your second question, i think it is working as described.
The sum on the WL column is -8,117.3555, divided by the 505 members currently in the list the average value comes to -16.07, matching the breadth and average value produced by the WL header row.
Thank you so much for explaining that. You are a smart guy. Don’t waste too much time checking into it. My computer is old and has poor computing power. I get glitches all of the time where Optuma tells me I have run out of memory and there is this or that error requiring a restart. Thanks again.
I have a question about the “ISMEMBER()” function in the script for the breadth module. Darren, you wrote in another threat that the “ISMEMBER() function only works with true/false conditions, not when calculating averages.”
In the above breadth scripts we calculate averages so the ISMEMBER() makes no sense.
There is now my question/issue: If I set the breadth module property “Membership” to “Current” the historical results are the same as when I set it to “Historical”. If I add the ISMEMBER() function to the breadth script, the results are completely wrong.
But that shouldn’t be the case in my opinion. When I set it to “Historical” and would use/could use the function ISMEMBER() the historical results of the script should be different than setting it to “Current”.
By the way, the same problem occurs when I calculate the average drawdown using the following script:
I believe you can use ISMEMBER() in an Average based breadth, but it needs to be setup differently. In this example the script would be modified to include ISMEMBER this way…
Here’s a comparison of the above script using Historical vs Current memberships (Historical is Blue, Current is Green):
You can see the lines are pretty identical near the recent price action, but differs more and more the further back the breadth goes, as memberships change.