Hi,
can anyone explain me how the following chart is done?
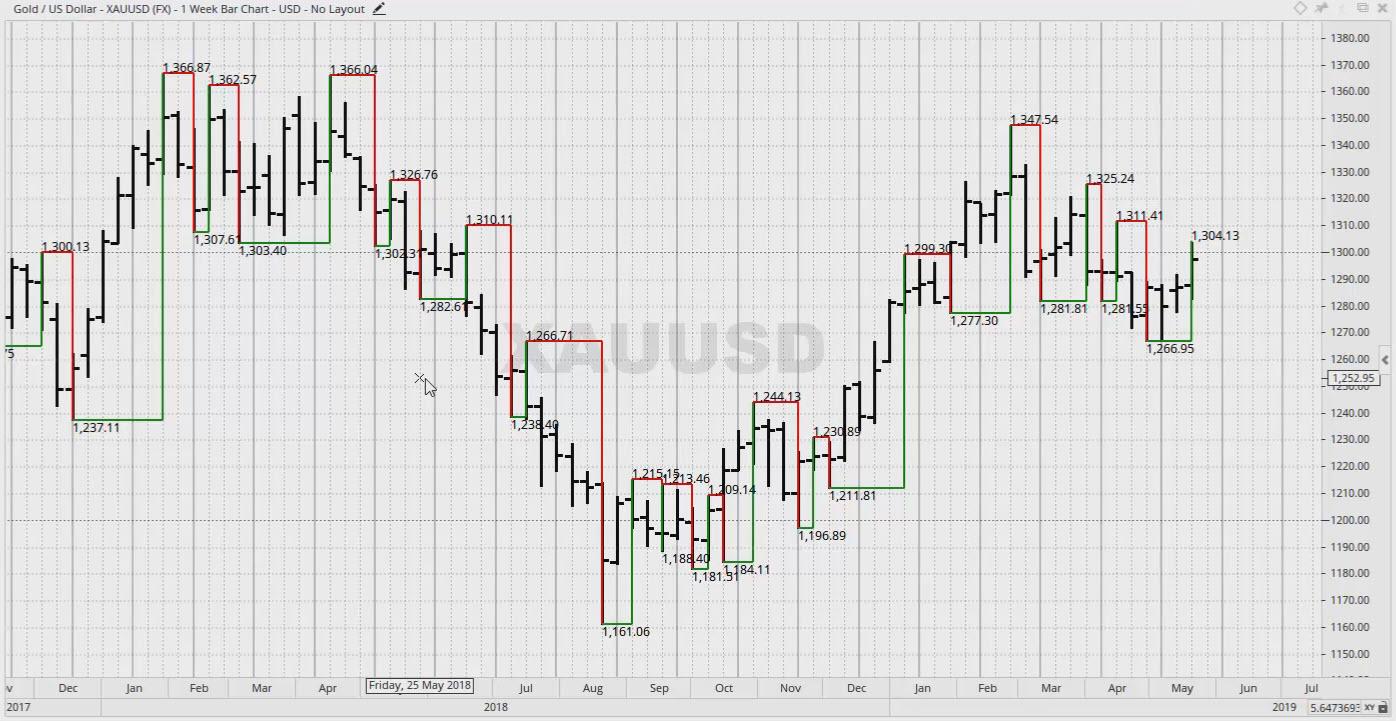
I want also the numbers below the swings!
Thanks a lot.
Thomas
Hi,
can anyone explain me how the following chart is done?
I want also the numbers below the swings!
Thanks a lot.
Thomas
You set up a standard bar chart, add a Gann Swing Overlay (GSO), tick the Show Labels setting for the GSO and then select which labels you want displayed. Price is one of the options.
Hi Piers,
thank you for your tip.
Two notes to the issue.
First note, the Gann Swing Overlay has the “symbol” (GSC) and not (GSO), but that is not really important.
Second note, the really important issue about the example above is the setting “Boxed” of the “Draw Style” properties. The standard setting of the “Draw Style” properties is “Point to Point”.
Once again thank you Piers for your tip.
