Hello, I am trying to build a graph of the S&P excluding the Tech sector. Is there a best way to do this. I could simply subtract XLK from SPY, but that is misleading and not accurate. I also could divide the S&P by XLK, but that too does not show what I want it to.
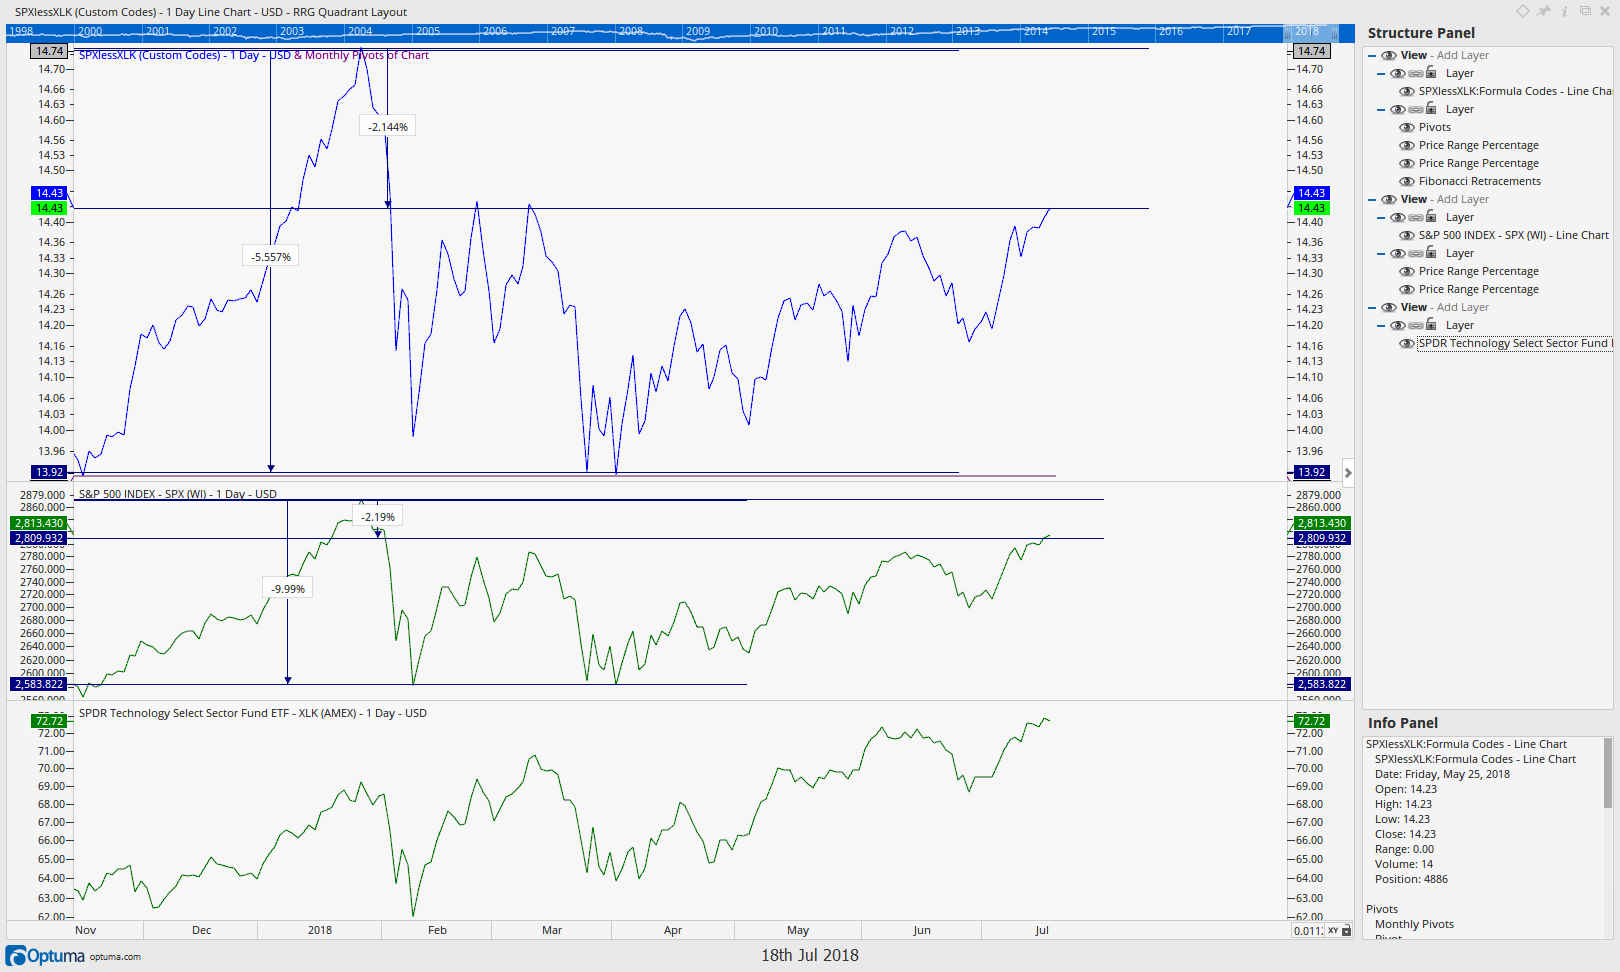
I am looking for a performance chart of SPY excluding the performance of XLK. Any ideas on best way to do this? Thanks. Attached is the SPY less XLK chart with the following code, but still I don't believe this is the correct way to do this.
Unfortunately there’s no easy way to do this. Because the SPY is market cap weighted we would need to take out the percentage made up by XLK… I know the current value is about a quarter but obviously that changes over time, and we don’t have that data readily available.
Further to Darrens reply, you would need know the weight of the technology sector. Ie if tech went up by 5% and every other sector was flat, then the S&p would go up 1% (if tech was 20% by market cap).
Once you have this information you can setup a calc to remove tech by subtracting the value of the tech sector multiplied by the market cap of tech divided by market cap the whole Index.