Hi,
I am here again and hope I keep you at Optuma not too busy with my posts.
This time I have some thoughts about the tool “Beta”. I made some calculations in Excel and have recognized that Optuma uses the normal percent change calculation to calculate beta and not the LN calculation as it is common in finance.
Here is a chart of the weekly and monthly beta of Apple.
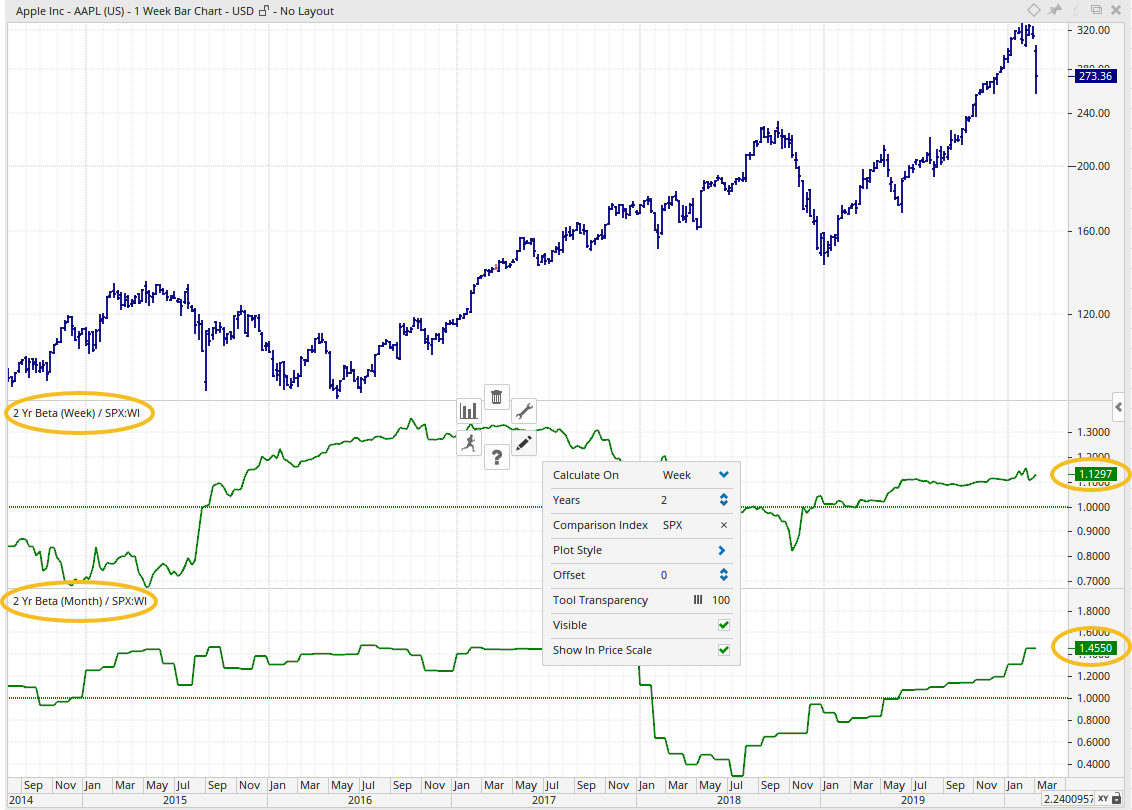
These calculations are of course correct!!!
But if I would use the LN to calculate the weekly percent changes I would get for the weekly beta 1,1363 and not 1,1297 what I would get if I would use the normal percent change calculation.
If I would use the LN to calculate the monthly percent changes I would get for the monthly beta 1,4407 and not 1,4550 what I would get if I would use the normal percent change calculation.
These differences are small but notwithstanding great enough to have great effect when you use them to make calculations for portfolio optimizations.
On the other hand it is confusing if you get in Optuma a different value than the one I have calculated in Excel or I get from another source. It would be good to have the same values from all sources and as already mentioned in finance it is common to use the LN to calculate percent changes.
In the tool “Regression Analysis” the beta is also calculated. So it is necessary to consider this tool too when changing the beta calculation.
In this context, I would also like to mention my post in the script forum
https://forum.optuma.com/topic/beta-function/
I have attached an Excel file with all my beta calculations so you can verify my calculations.
Thanks
Thomas
Beta-Calculation-in-Excel.xlsx (48.2 KB)

