I’m lazy and want to have one “tool” I can add to my toolbar that shows the Bill Williams Gator - which is basically 3 moving averages, with each MA offset into the future (1 MA 8 bars, 1MA 5 bars and 1 MA 3 bars).
This is pretty easy as individual MA’s but one that draws the three at one time (with the required different offsets) I’m stumped how to add the required offsets for each MA. The OFFSET function doesn’t plot the line into the future as required as simply shows the value at a certain offset at current price bar.
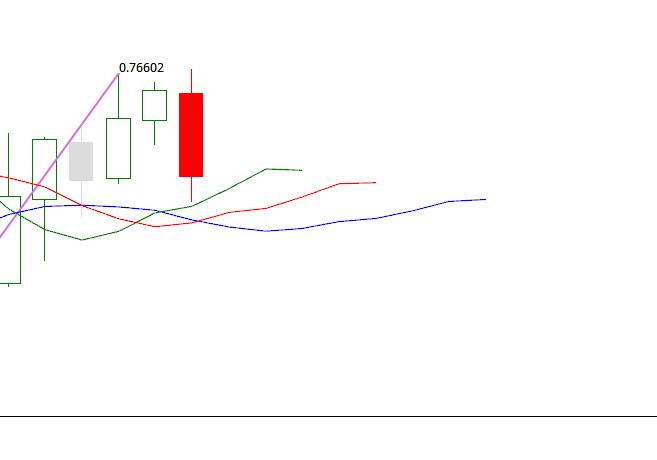
I compared the output of this code with that shown for FaceBook in the Investopedia article on Bill Williams Alligator and achieved the same results☺ The high in that FB chart is 1 Feb 2018.
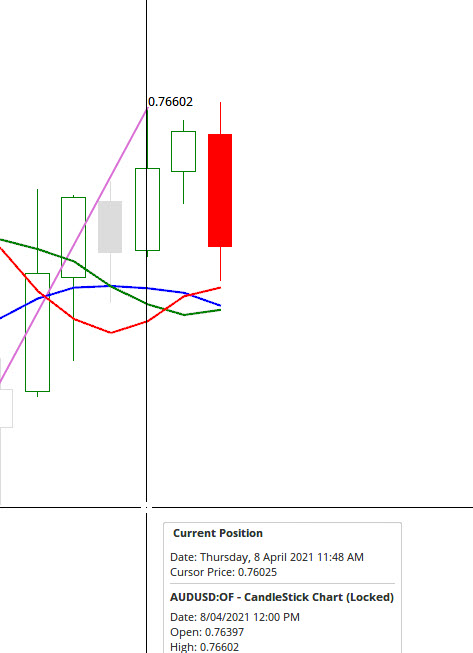
The MAs are offset, but just not extending beyond the last bar.
I suspect, but this needs to be confirmed by Optuma experts, that the MAs will not extend beyond the last bar because there is no bar data and the data array that supports the MAs relies on the bar data array.
I have had no success in getting a script to display the Williams Alligator as you require, however I have created an Optuma Custom Tool that will do exactly what your desire:
You can obtain the “Bill Williams Alligator” indicator Custom Tool for Optuma through my web site Auld Tyma Data
You are kidding aren’t you, Trevor.
You want to charge $30 for forum advice that costs nothing if he reads my instructions above. That is not really in keeping with the spirit of these forums, is it?
I also doubt that commercial advertising, particularly opportunistic misguidance such as this, will be well regarded by Optuma and its community of users.
I don’t like to make this kind of post, but I could not let him get sucked in, especially when you brazenly proposed to charge him in the post immediately following the post that gave the information for free.
Why buy the same tool from you, when the instructions produce the identical result?
Reconsider, Trevor.
cheers
Michael
PS. I have attached a Tool Group file to this reply which contains several moving average tools including the Alligator. Download the file, then, in Optuma, right click on the toolbar area and select Import Tools.
Okay, so you have a different approach to solving the problem.
The original question from Steven was for a scripted solution. Your’s is not a scripted solution.
It would have been far more helpful if you had explained exactly how you did it in the first instance because it was not obvious. The first few lines of your post didn’t clearly show that you were creating three separate moving averages and setting their properties in a Layer before attaching that Layer to the Toolbar. Had you done that, then your instructions would have been clear.
It is now up to Optuma users to decide which approach to follow, yours which is still not clearly explained, or my Custom Tool approach.
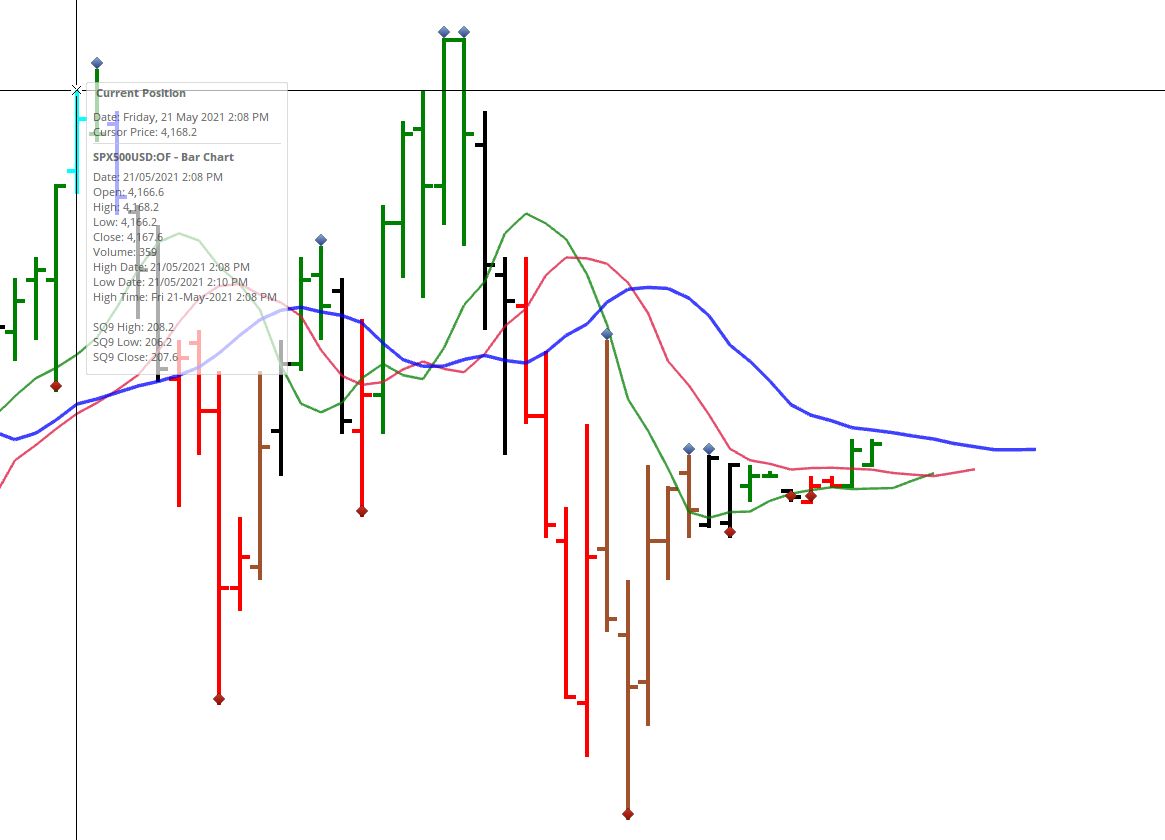
By the way, I’ve used Bill Williams for a number of years too before giving trading a break - and am now teaching my son and their mates in Forex and introducing them to the Gator, Wisemen, Fractals etc… Forgot how simple and effective his methods were
You can’t apply an offset in a script, so Michael’s method is best for displaying on a chart but Trevor’s method would be best for scripting a scan.
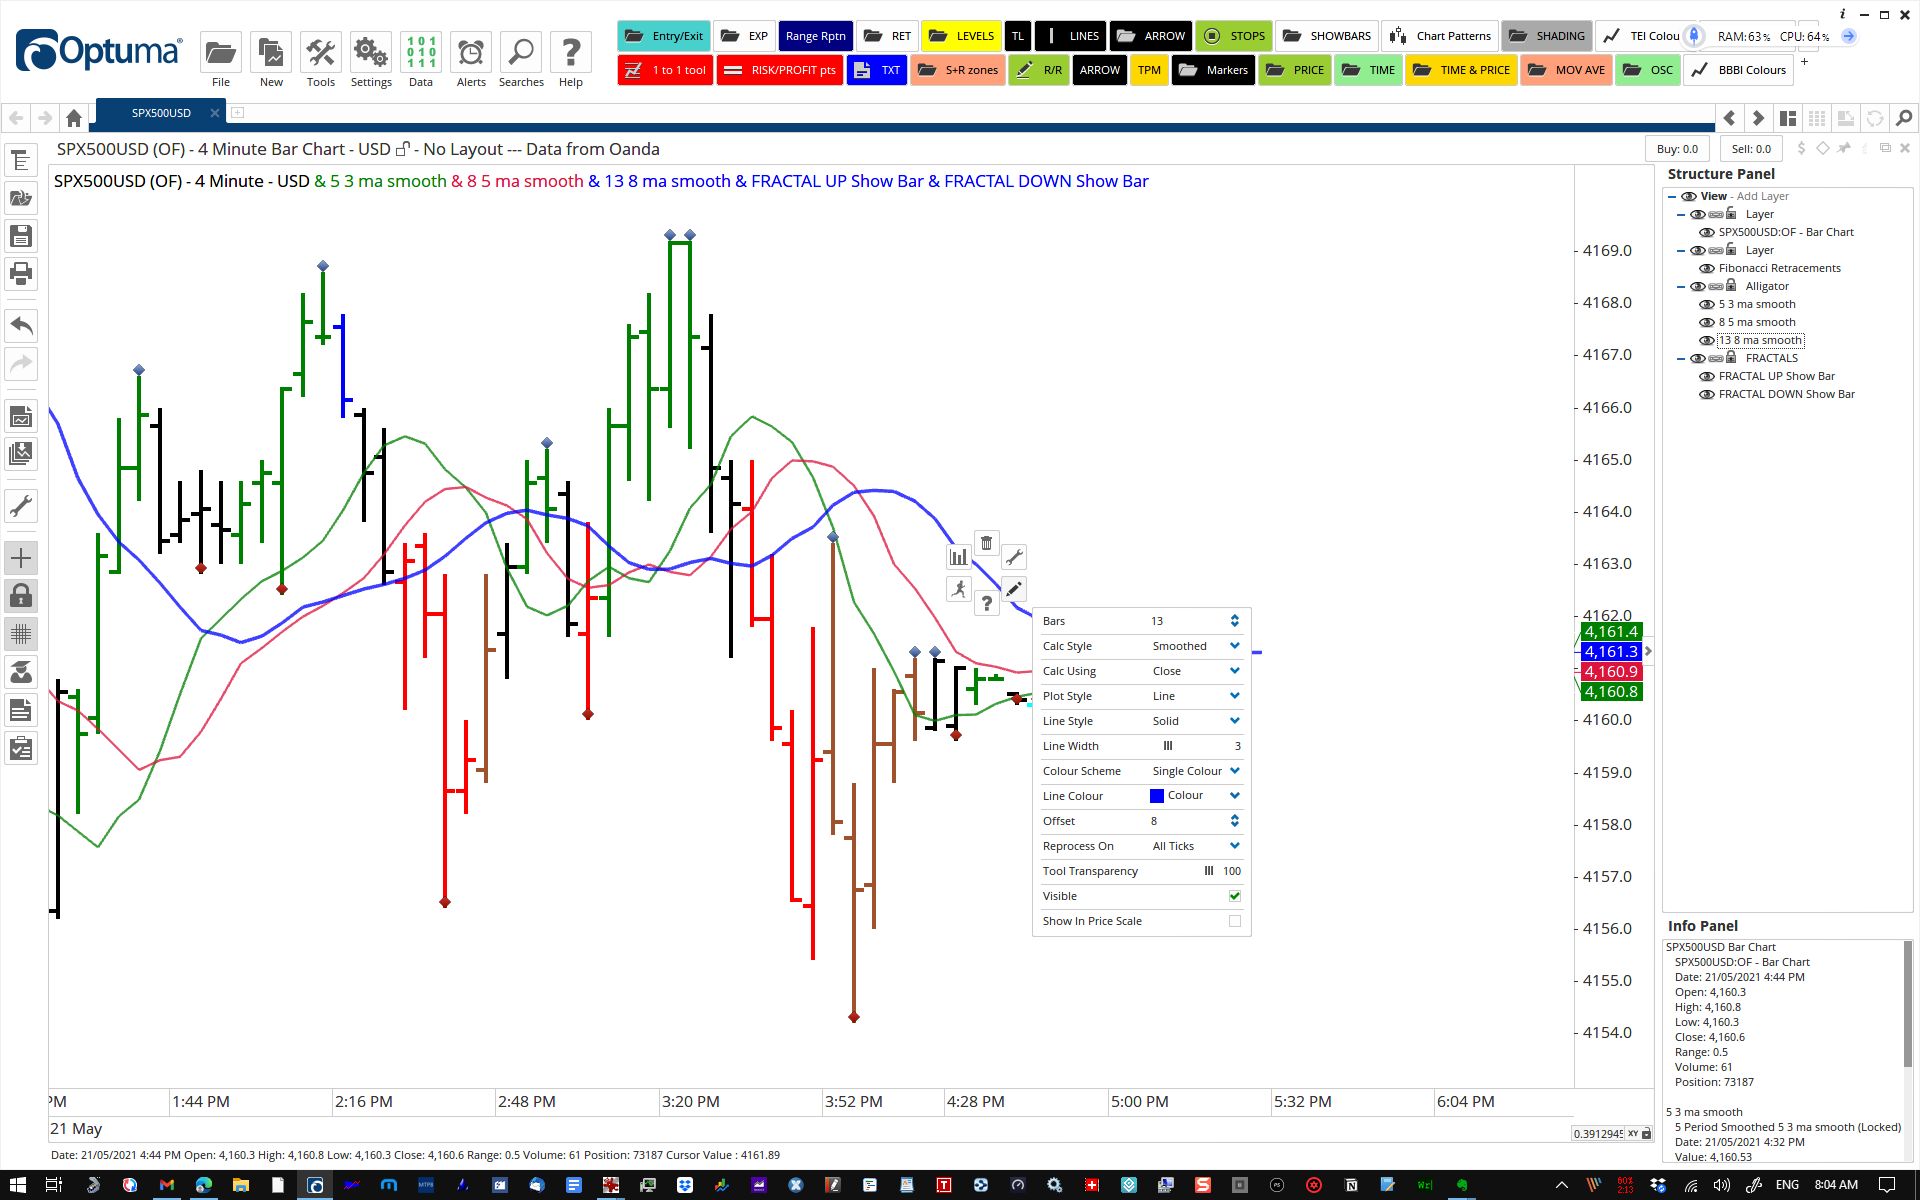
Steps for the chart:
Add your three Moving Averages to the chart.
For each, use the "Offset" property to move the line to the left by the required amount.
NOTE: An offset of 5 is different than scripting MA()[5]. That script would get the value from 5 bars earlier and put that in today's value. The value is right for today, but it will not project forward.
Then you can select all three and add them as a tool button. Jump to the 2:40 mark in this video for an example https://help.optuma.com/kb/faq.php?id=576
Hope that helps
Mathew
FYI I have no problem with Trevor offering his services to help people. We have so many projects on that we can not address all the different things that people want to add. That leaves a consultation with our support staff or another client who is able to script. Obviously, we can not endorse their work since we do not control it.
Any plans for Optuma to allow that in scripting as I would have though scripting a tool (MA for example) with ALL the options available when adding to a chart would be pretty straight forward. As there is the offset capability for MA’s and the like Eg Ichimoku Cloud’s, I’m surprised you can’t script it as well?