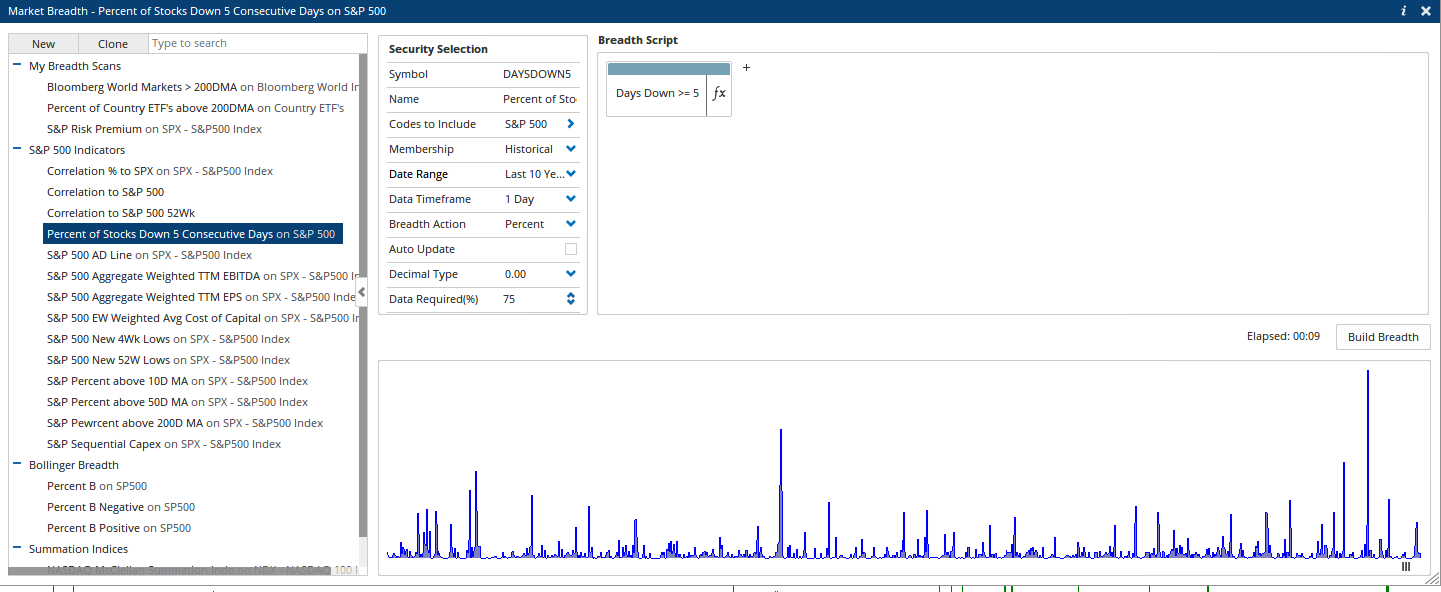
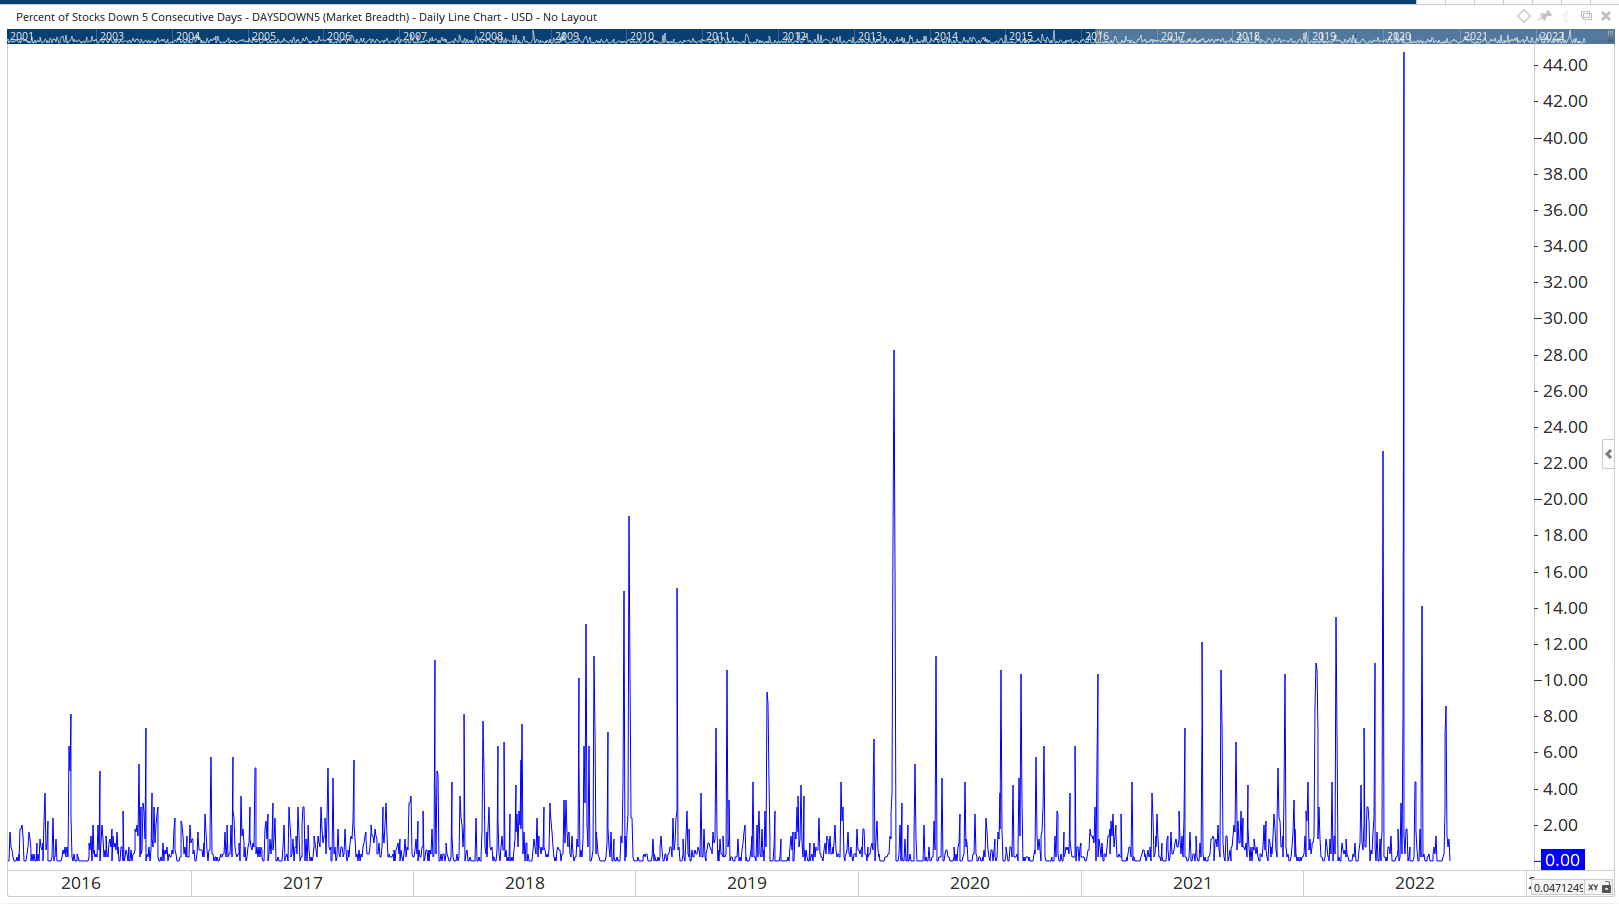
I was trying to use the DD Days Down function to recreate the attached chart. I was using DD() >=5; ( I also used DD()==5; ) but still not the same to see the percentage of days with 5 consecutive days down but I don’t seem to match the results of the chart so perhaps my understanding of the function is incorrect. I was using the SPX:WI list using percentage as the output with a 75% threshold.
DD() >=5 should work, but make sure you are running the breadth on the S&P 500 Symbol List set to historical members and not just the SPX:WI (which is just the index).
OK thanks. Mine was built off of our end-of-day database so it could be that you have the data coming from Bloomberg, so not all the data has been downloaded for the calculation to work.
If you click on Data > Exchanges > US Equities and make sure the End-of-Day Provider is set to Optuma, with the Last Date Downloaded showing August 30th. If not, click Import Data History to get the complete historical data to last Friday, and then change Last Date Downloaded to August 26th and click Download Daily Data to get this week’s data.
Once complete, close all charts and run the breadth calculation again. Contact [email protected] if you still have issues and we’ll investigate further.
Darren, I was originally running this on Optuma data not Bloomberg data. I did re-import the data history and then updated the data. I am now getting what appears to be the same results as your scan. Thanks for the help.