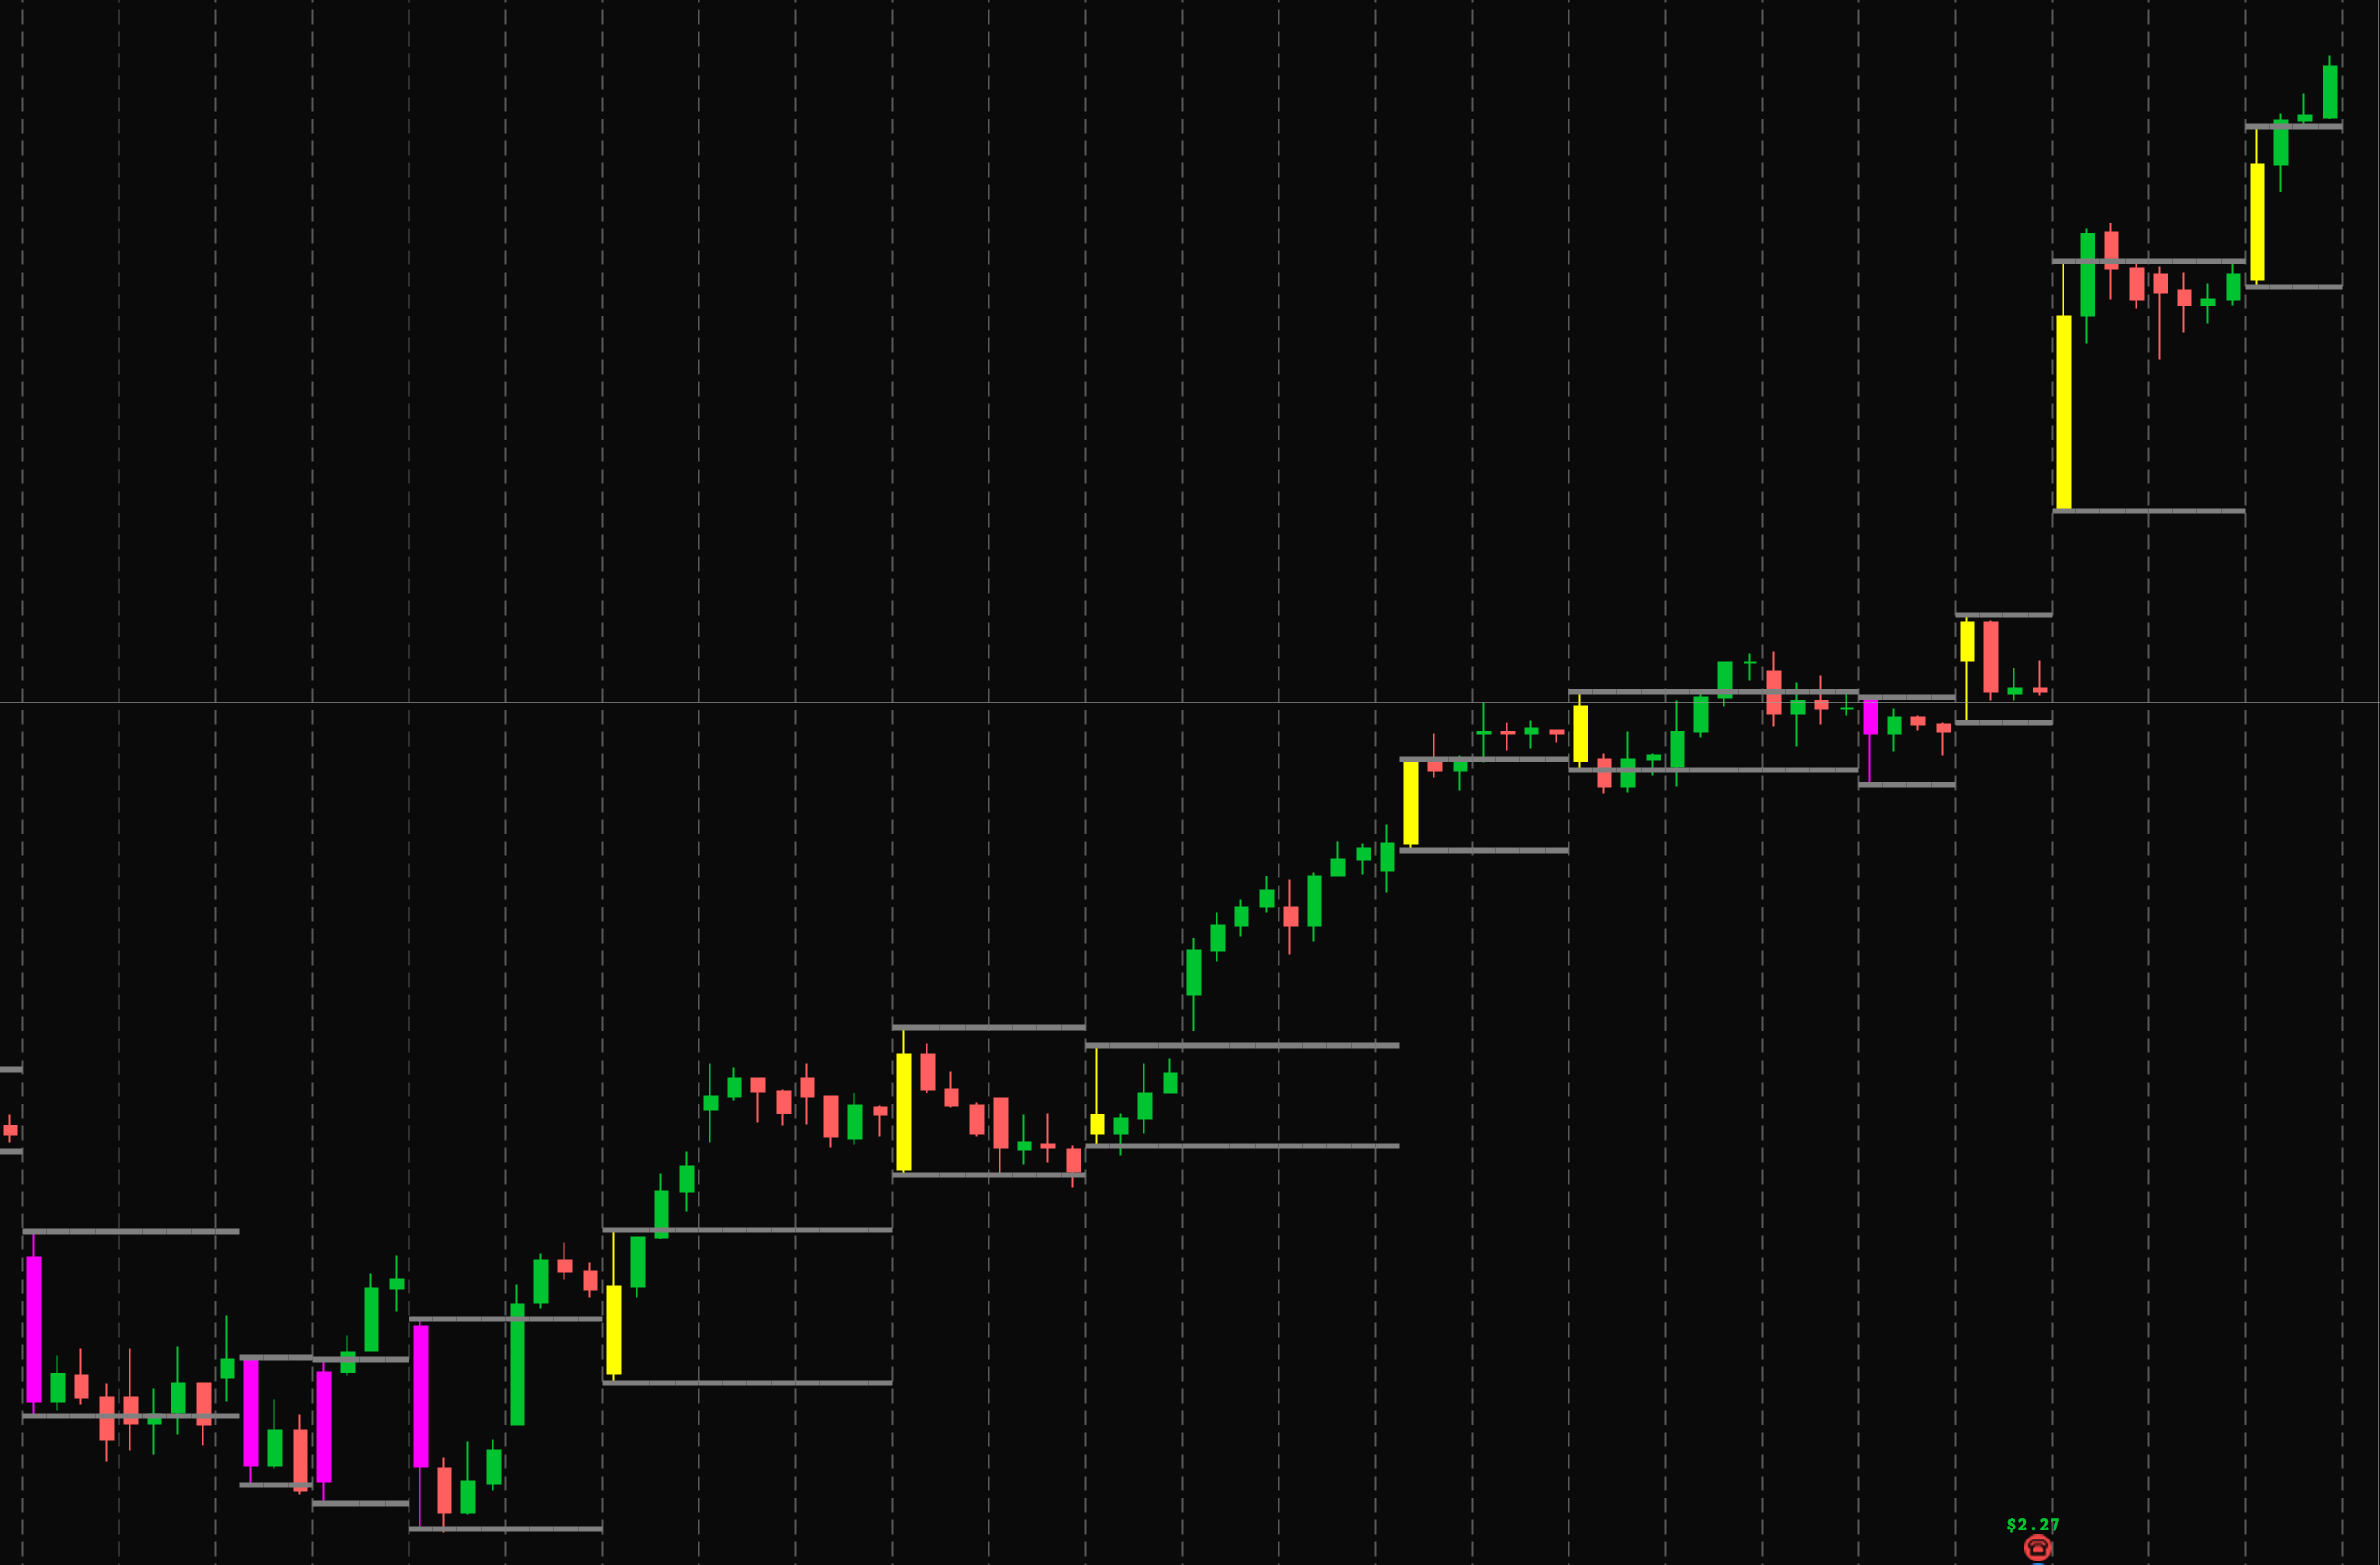
Please see photo. Is there a way to plot breakup and breakdown candles with horizontal lines which create trading ranges.
Hi,
It maybe possible but you would need a way to define the criteria of what constitutes a breakout candle. If you have a set of rules for that candle we can look at how the lines could be scripted.
Thanks for the reply. The study is based the largest range candle with in a period of time which creates trading ranges for larger intaday time frames, ie, 30,60,120,240 min
here are the code inputs
#Breakout/Breakdown based upon input of BigBarsize (Current bar’s range is at least input of bigbarsize multiple of the highest range of the input of number of priorbars)
#Three options for alerting a BigBar Breakout/Breakdown
#Added input last_bars_displayed to show the actual bar color of these input number of bars, except breakout and breakdown bars, which will always be colored yellow or magenta. All other bars will be colored gray.
#Added optional horizontal lines at high/low of breakout/breakdown bars, with options to show clouds and limit the length of the lines/clouds
#Added Average of breakout/breakdown bars
input priorbars = 3;
input bigbarsize = 3.0;
def range = high - low;
def breakout = if high > Highest(high[1], priorbars) and
range >= Highest(range[1], priorbars) * bigbarsize
then 1 else 0;
def breakdown = if low < Lowest(low[1], priorbars) and
range >= Highest(range[1], priorbars) * bigbarsize
then 1 else 0;
def lastbar = if !IsNaN(close) and IsNaN(close[-1]) then BarNumber() else Double.NaN;
input last_bars_displayed = 5;
input coloralert = yes;
AssignPriceColor(if coloralert and breakout then Color.YELLOW else
if coloralert and breakdown then Color.MAGENTA else
if BarNumber() < HighestAll(lastbar) - last_bars_displayed then Color.GRAY
else Color.CURRENT);
def b_high = if breakdown or breakout then high else b_high[1];
def b_low = if breakdown or breakout then low else b_low[1];
input show_clouds = yes;
input show_horizontals = yes;
input limit_cloud_length = yes;
input cloud_length = 10;
def b_length = if breakdown or breakout then 1 else b_length[1] + 1;
plot hh = if show_horizontals then
if limit_cloud_length == no or limit_cloud_length == yes and b_length <= cloud_length then b_high
else Double.NaN
else Double.NaN;
plot ll = if show_horizontals then
if limit_cloud_length == no or limit_cloud_length == yes and b_length <= cloud_length then b_low
else Double.NaN
else Double.NaN;