Hi Optuma team,
on your Twitter account you have published the following chart:
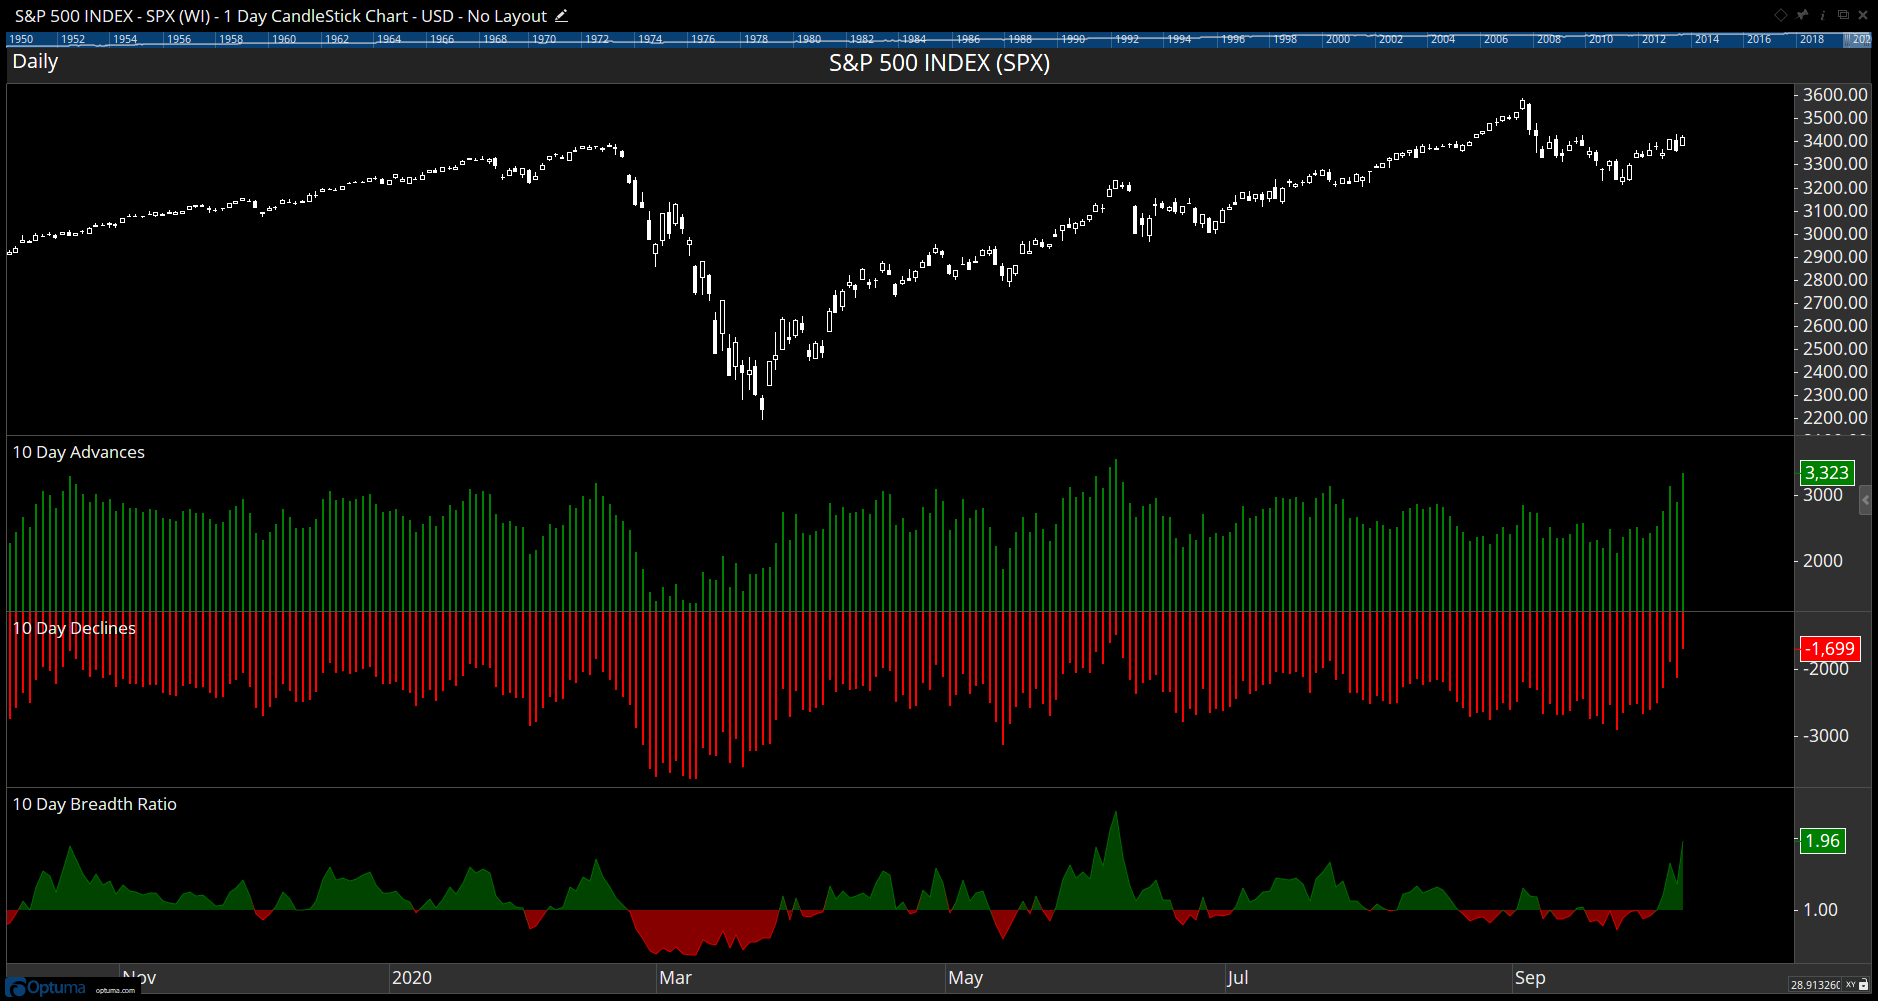
Please explain me how you have created this chart, especially the 10 Day Advances (green bars) and 10 Day Declines (red bars) tools.
Thanks
Thomas
Hi Optuma team,
on your Twitter account you have published the following chart:
Please explain me how you have created this chart, especially the 10 Day Advances (green bars) and 10 Day Declines (red bars) tools.
Thanks
Thomas