Calculating Retracements

Here’s a formula to calculate how far a stock has retraced from the recent swing down in Feb/March 2020 as per this Tweet [for Gann swing retracement scans please see here].

The following gets the highest high between January 1st and February 29th 2020, and the lowest low between March 1st and May 1st, and then calculates where the current close is within the range, which can be added to a watchlist:

//Get highest and lowest prices;
H1 = HIGHESTHIGH(RANGE=Range, RANGESTART=2020-01-01, RANGEEND=2020-02-29);
L1 = LOWESTLOW(RANGE=Range, RANGESTART=2020-03-01, RANGEEND=2020-05-01);
//Calculate the range
R1=H1-L1;
//How far is close from low?
C1=CLOSE()-L1;
//Divide C1 by range
C1/R1

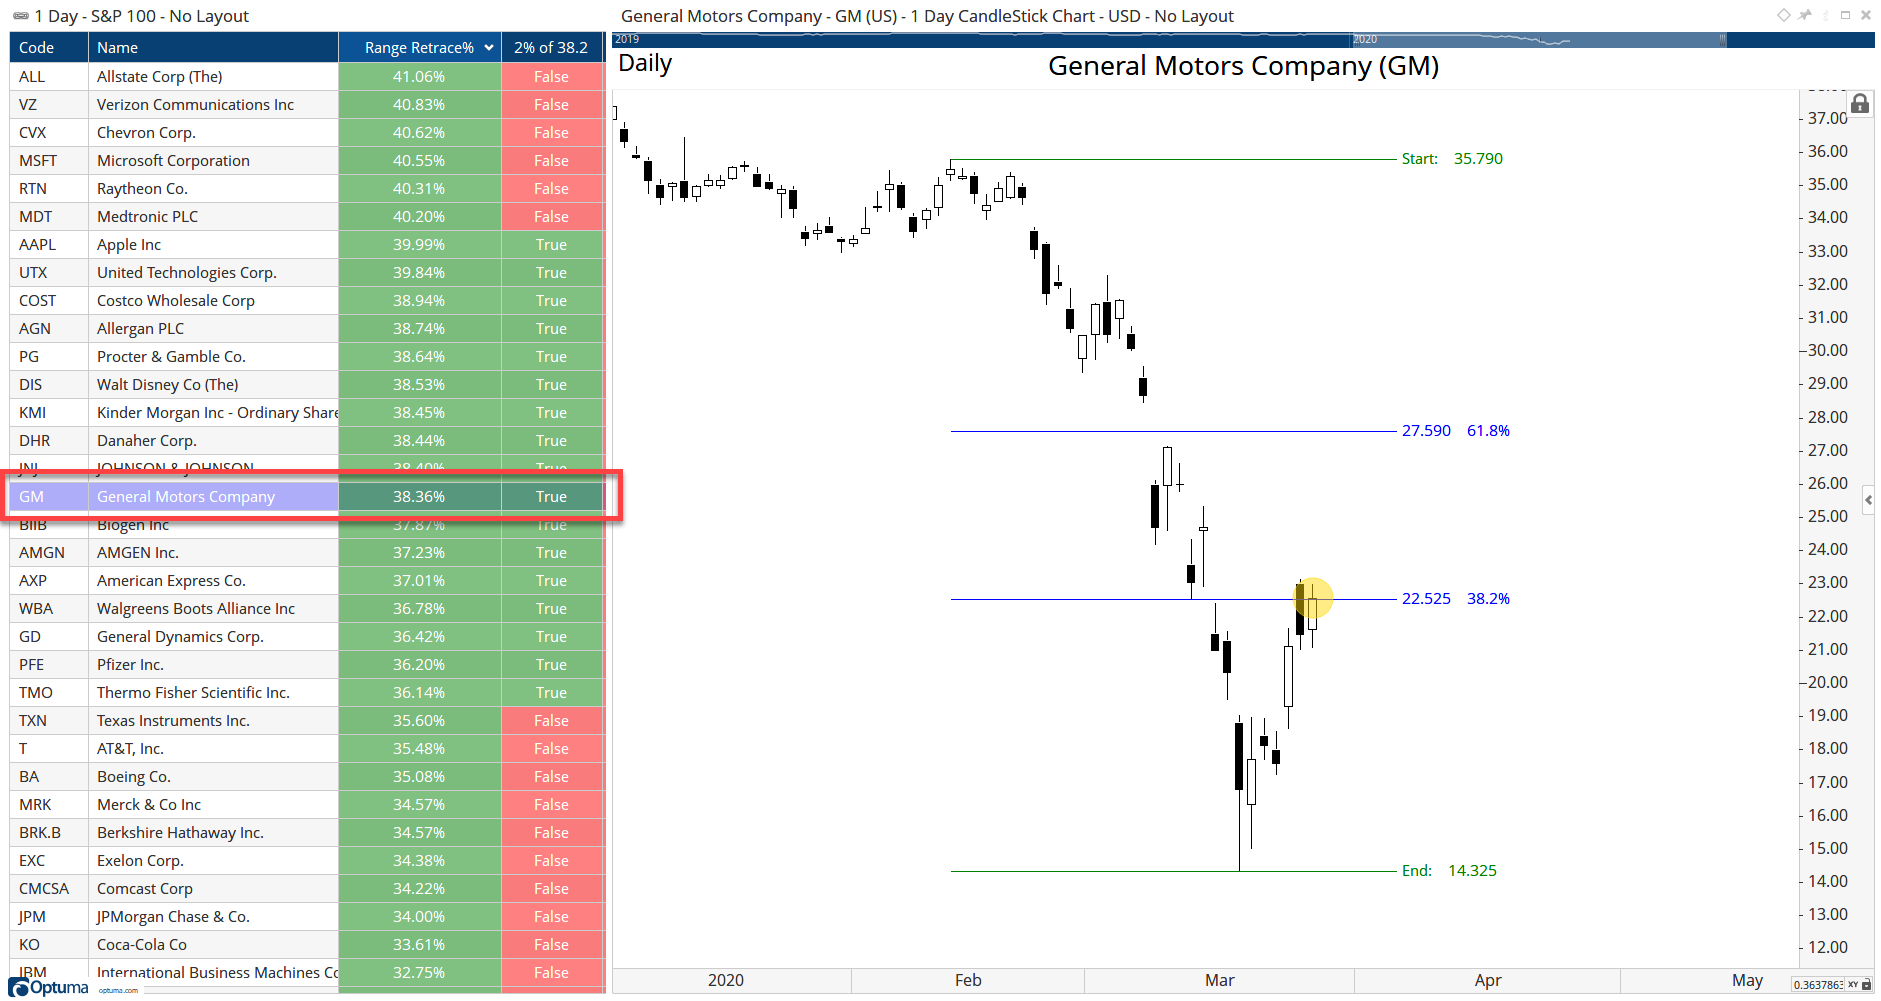
To scan for those within x% of a specific level (eg 50% or 38.2%) change the last lines to make it a Boolean:

//Divide C1 by range
P1=C1/R1;
//Is close within 2% of 38.2%?
P1>0.36 and P1<0.4;

In this example, GM has retraced 38.36%, so appears True:

Capture

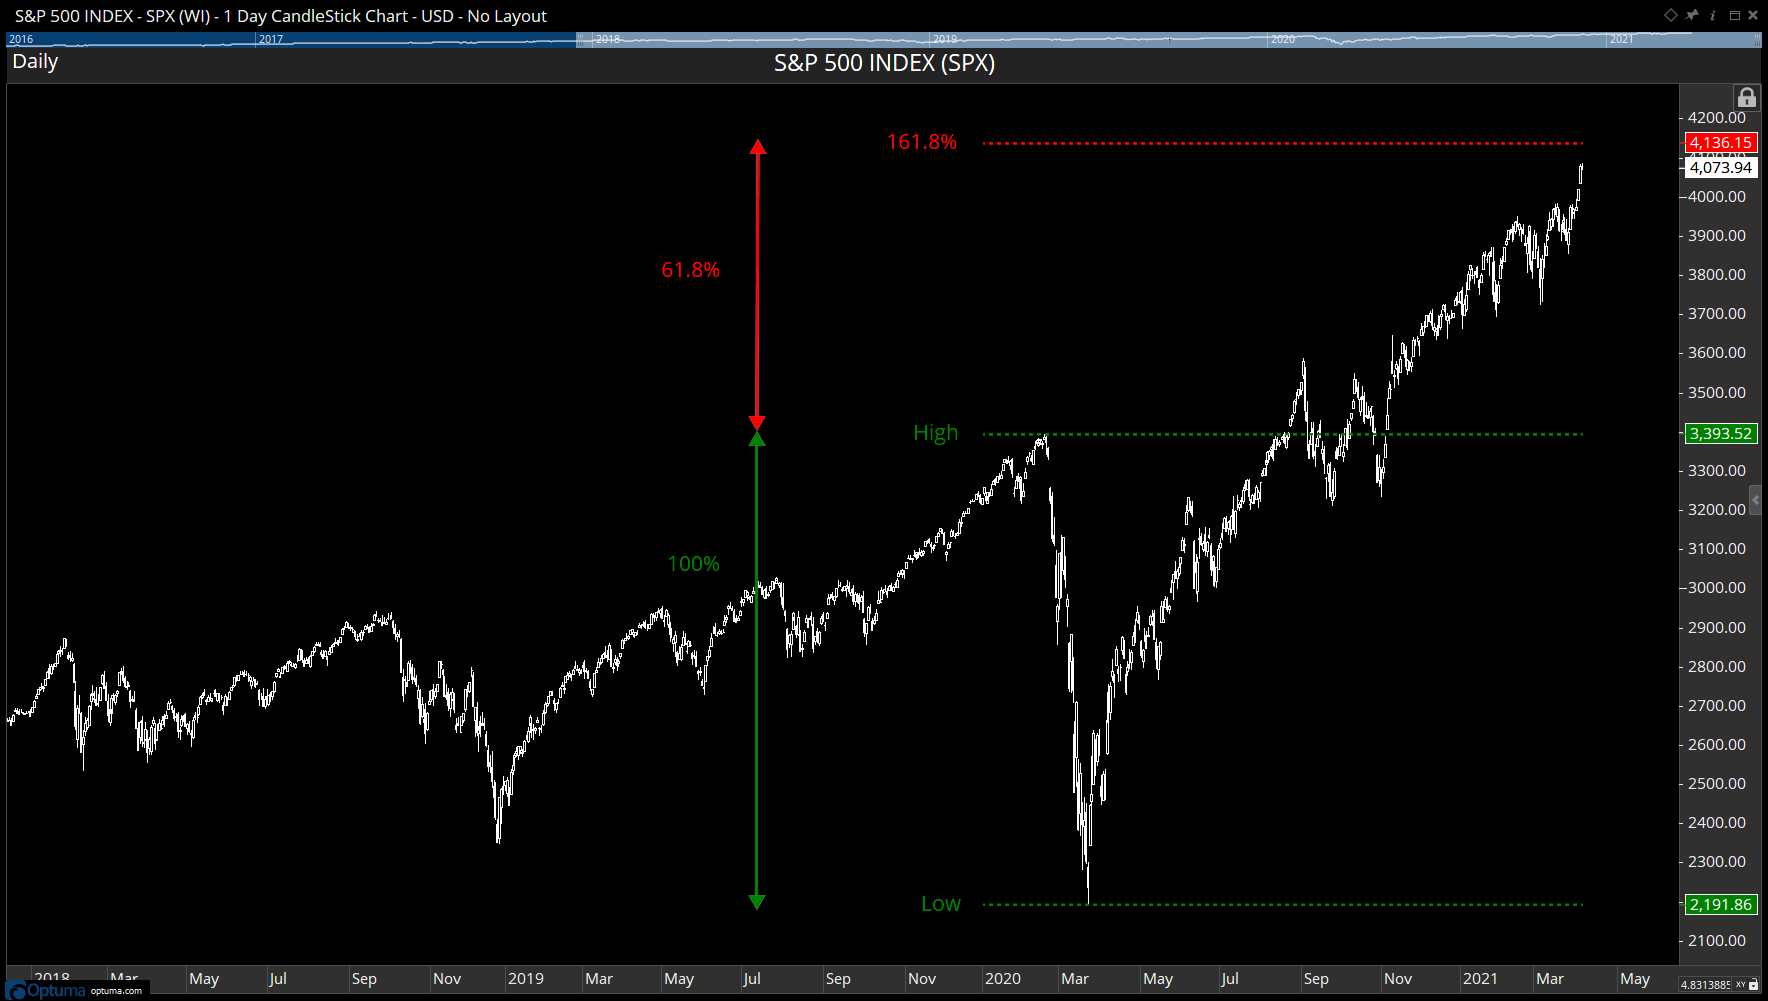
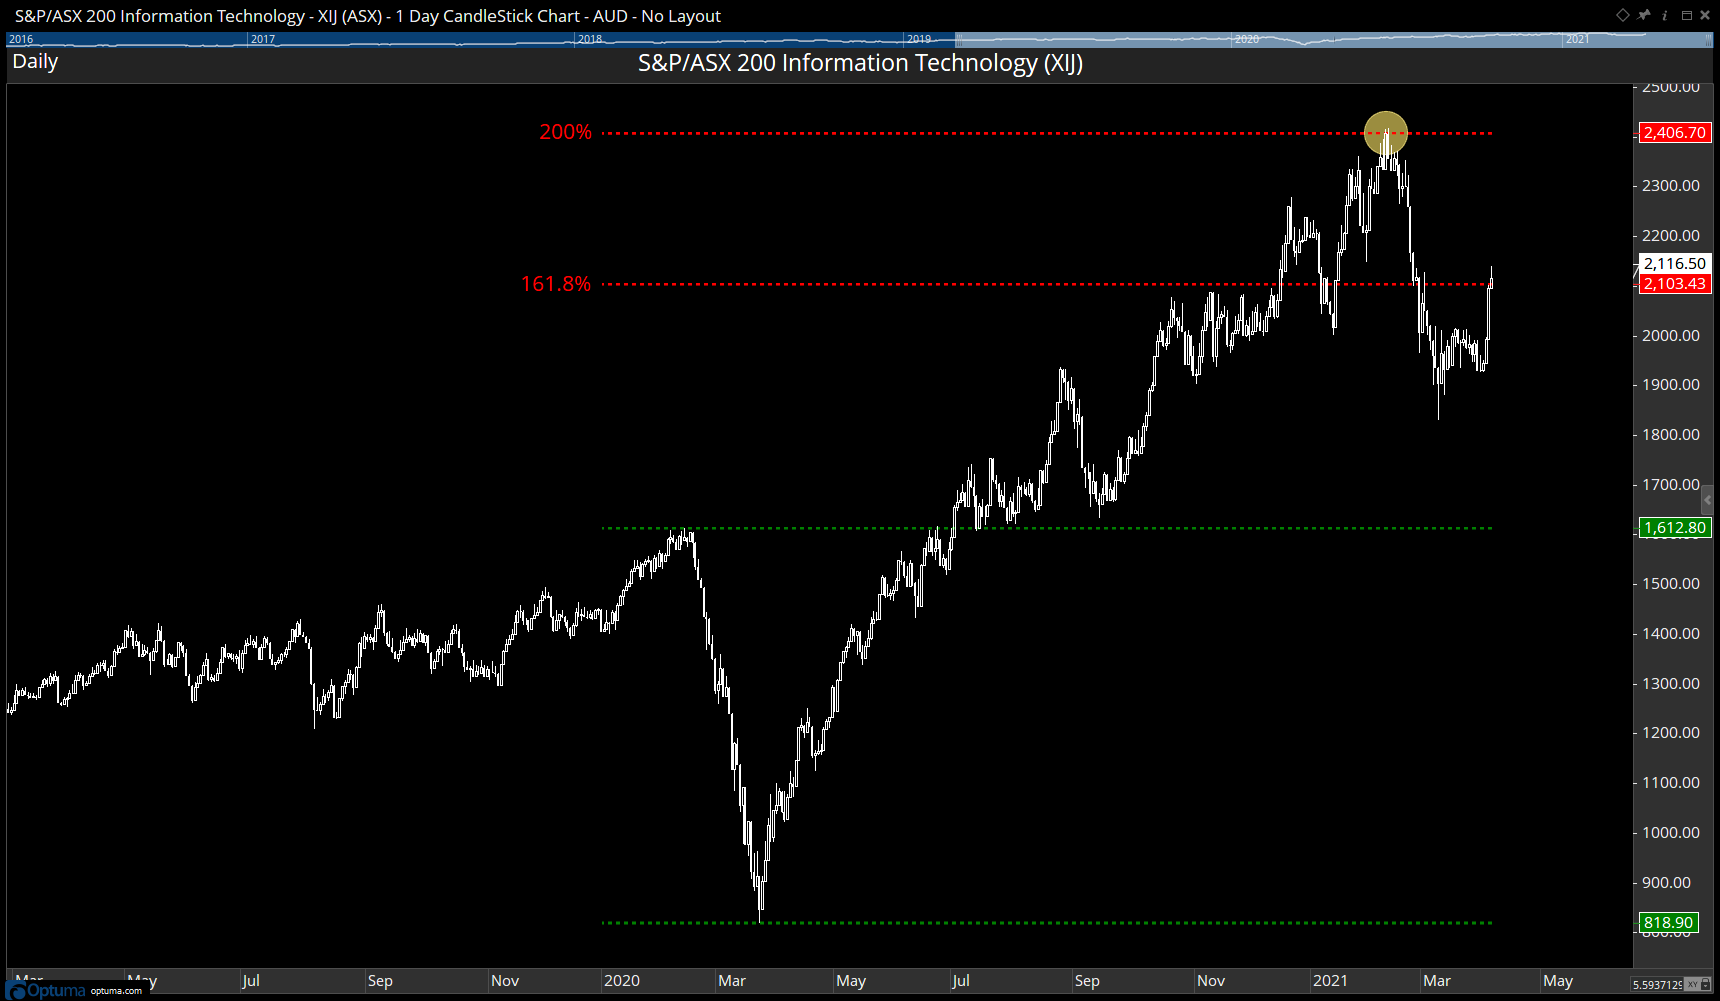
This retracement formula can be used to plot the levels on a chart, and from that its possible to plot any other level, such as the 161.8% Fibonacci extension level, or 200% measured move of the original price drop.

The following will draw the high and low values, along with the 161.8%, 200%, and 261.8% levels of the 2020 COVID Crash:

//Set Hi/Low date period;
H52 = HIGHESTHIGH(RANGE=Range, RANGESTART=2020-01-01, RANGEEND=2020-02-29);
L52 = LOWESTLOW(RANGE=Range, RANGESTART=2020-03-01, RANGEEND=2020-05-01);
//Calculate Hi-Low range;
R1=(H52-L52);
//Draw levels;
Plot1=LAST(L52);
Plot1.Colour = Green;
Plot1.Linestyle = Dash;
Plot1.LineWidth = 2;
Plot2=LAST(H52);
Plot2.Colour = Green;
Plot2.Linestyle = Dash;
Plot2.LineWidth = 2;
//161.8% level;
Plot3=LAST(L52+(R1*1.618));
Plot3.Colour = Red;
Plot3.Linestyle = Dash;
Plot3.LineWidth = 2;
//200% level;
Plot4=LAST(L52+(R1*2));
Plot4.Colour = Red;
Plot4.Linestyle = Dash;
Plot4.LineWidth = 2;
//261.8% level;
Plot5=LAST(L52+(R1*2.618));
Plot5.Colour = Red;
Plot5.Linestyle = Dash;
Plot5.LineWidth = 2;

To add extra levels duplicate from Line 26 down, change the formula in the next line, eg R1*3 for 300%, and replace Plot5 to Plot6.

Here’s an example of the S&P500 index approaching the 161.8% level at 4,136:

Capture

Here’s the ASX200 IT sector (XIJ) showing the reversal at the 200% level (2,406) in February 2021, and is currently trading at the 161.8% level:

Capture2

To automatically plot the retracement levels between the all-time low and all-time high use this in a Show Plot tool:

P1=LOWESTLOW(RANGE=All Time);
P2=HIGHESTHIGH(RANGE=All Time);
plot1=P1;
plot2=P2;
//Calculate required retracement levels;
plot3=P1+(P2-P1)*0.382;
plot4=P1+(P2-P1)*0.5;
plot5=P1+(P2-P1)*0.618;
//Define colours, etc;
plot1.Colour = Green;
plot2.Colour = Green;
plot4.Colour = Red;
plot4.Linestyle = Dash;
plot4.LineWidth = 2;

Capture