Just new, and just building knowledge at this point, but I’m intrigued by the Center MA type and would like more information about it.
I’ve searched everywhere, of course, but cannot find info on how it works.
It seems to move before price, which has me immediately suspicious . I cannot determine if it repaints, yet it doesn’t seem forward looking…
Can someone point me to more information about this, and perhaps how it is derived? I’d hate to rely on it without clearly understanding what it is, how it works, its strengths and pitfalls.
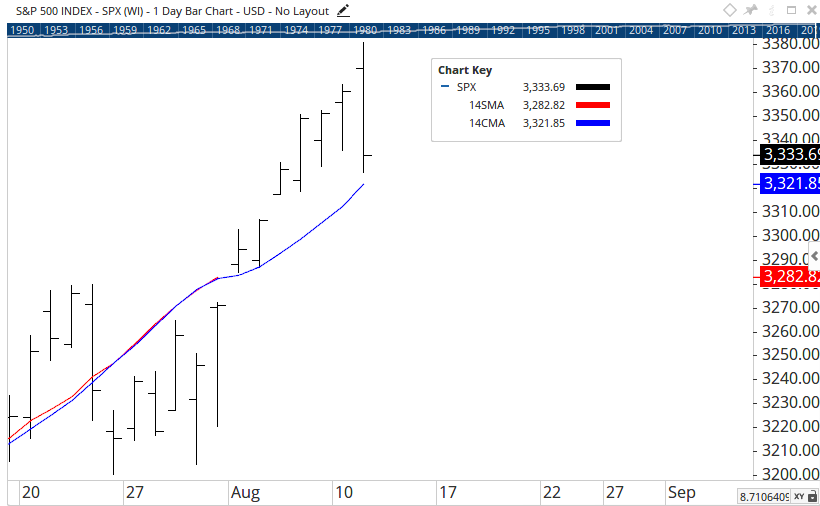
A centered moving average plots the current averages value at the mid point of the range being averaged. For example, if you used a 14 period moving average, the current days average would be plotted 7 bars ago.
The nature of this calculation means the line of the Moving Average halfway after the range being measured (7 bars in this case) is dynamic, and will change each day as new data comes in.
A good way to see this is to take a 14 day SMA and 14 day CMA on the same chart. Offset the 14 day SMA by -7 and you will see both MA values match (or are very close).
This MA Style is mainly used in Cycles Analysis to help in determining cycle length. It is not used as a calculation in systems because the final value can change. Due to the dynamic nature of the MA line after the midpoint, this type of Moving Average is not suitable to be used on back testing.
Thanks Matt - yeah, I suspected something like this. The behaviour of the thing seemed a bit odd, but I couldn’t find any information on it. Hopefully your reply can help others who are also curious.