*** UPDATE: Chaikin Money Flow is now available as a standard tool in Optuma. Click here for details. ***
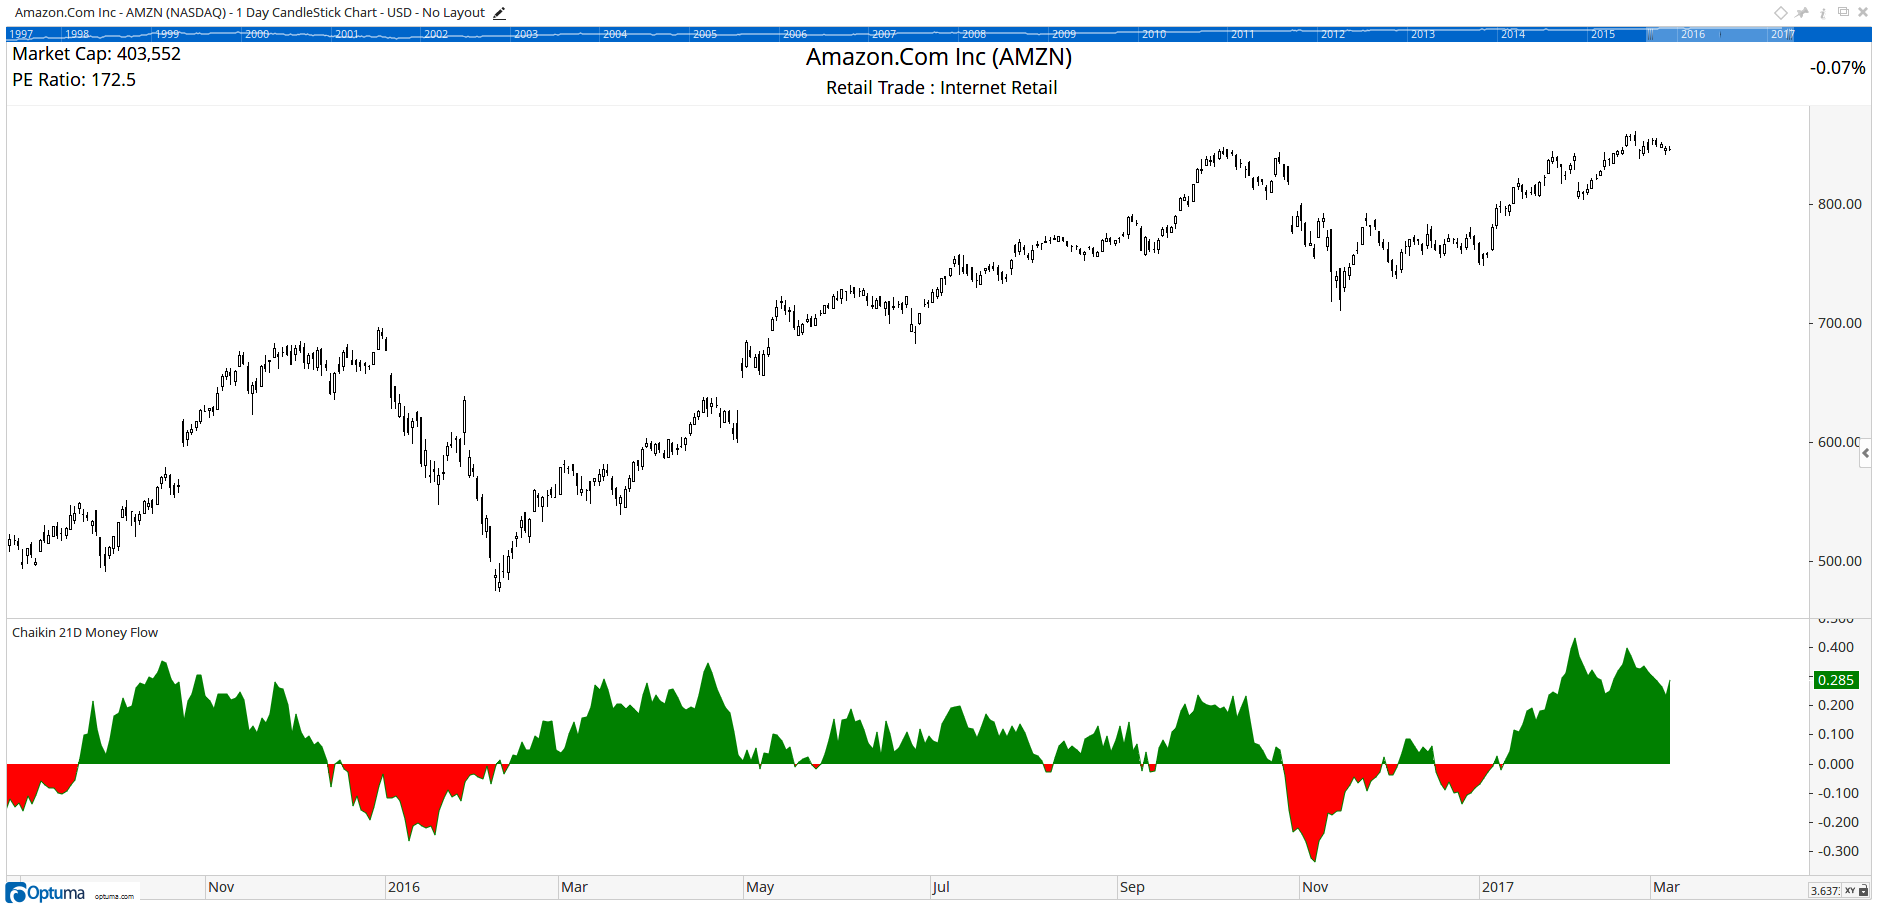
The following script can be used to create the 21 day Chaikin Money Flow Indicator. The lines beginning with // are comments and will be ignored in the script editor:
// Calculate the Money Flow Multiplier
CAD1 = VOL() * ((CLOSE() - LOW()) - (HIGH() - CLOSE())) / (HIGH() - LOW());
// Use the ACCUMULATE function to sum the multiplier over 21 days
A1 = ACC(CAD1, RANGE=Look Back Period, BARS=21);
// Use the ACCUMULATE function to sum total volume over 21 days
V1 = ACC(VOL(), RANGE=Look Back Period, BARS=21);
// Calculate the ratio
A1 / V1
Hi Darren/Optuma
I use Optuma’s Chaikin Money Flow indicator a lot but wanted to compare it with Twiggs Money Flow, which Optuma doesn’t have in the tools menu. Is there any chance you could script it for me. I have found a Twiggs formula available publicly, which might help to create a script. If this is possible, I would very much appreciate it as one of my strategies requires Twiggs over Chaikin. I have split the formula into steps:-
Twiggs Money Flow calculation could be split into several steps:
To Calculate Highest High (HH) and Lowest Low (LL)
LL = minimum(current low or previous close)
HH = maximum(current High or previous close)
To Calculate TMF (Twiggs Money Flow):
TMF = EMA[Volume ((Close - LL) / (HH - LL) * 2 - 1 )] / EMA[Volume] * 100
or by steps:calculate range
Range = (Close - LL) / (HH - LL) * 2 - 1 )
or
Range = (2Close - LL- HH) / (HH - LL)
To Calculate Range Volume (weighed by the Range volume)
RangeV = EMA (Volume * Range)
To Calculate TMF
TMF = RangeV / EMA(Volume) * 100
Apply EMA to TMF as second signal line
As per Mathew’s pinned post, we’re happy to help with your scripting questions and point you in the right direction, but unfortunately we can’t build the script for you (unless you want to arrange a consultation).
The best way to start is to break down the formula in to sections as you have done, and build the individual components on a chart using Show Plots and Show Views so that you can verify that each one is doing what you expect.