Hallo and a Happy New Year,
and here I am again with new questions.
On the Optuma Twitter account I have seen the following chart.

I would be very pleased if I can get the script to calculate the “% from Annual Low”.
Elsewhere I have seen the following chart.
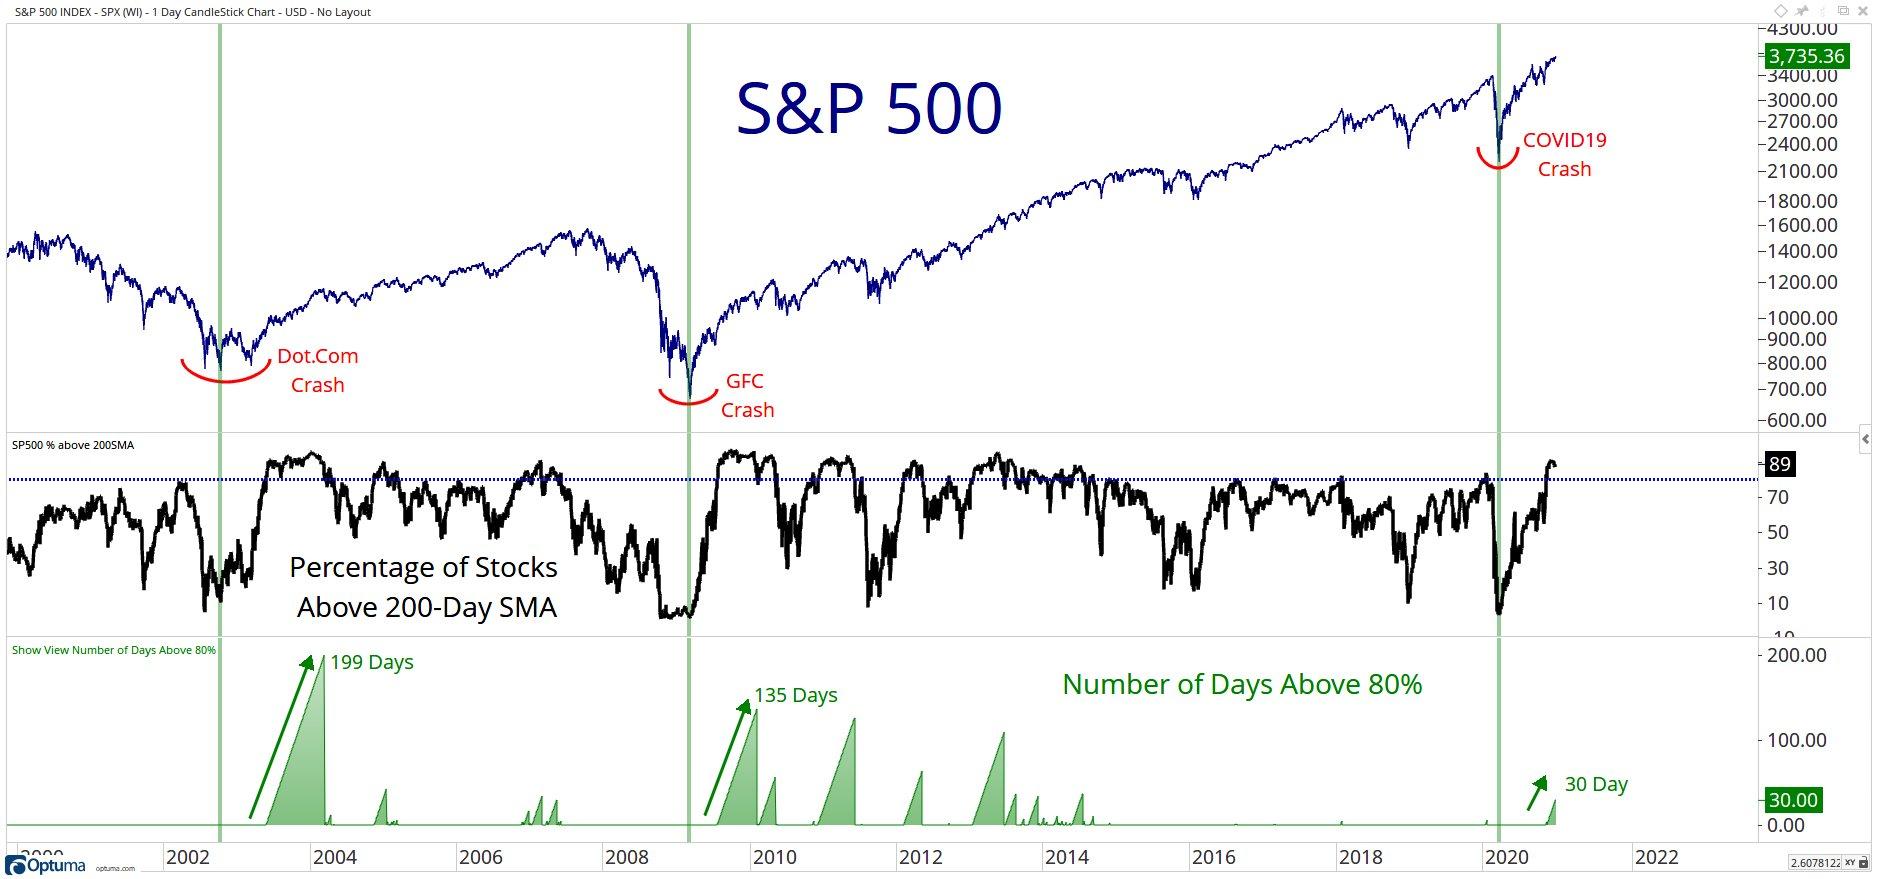
Again, I would be very pleased if I can get the script to calculate the “Number of Days above 80%”.
I have tried some solutions but unfortunately my “solutions” are not really what they should be.
Many thanks,
Thomas