Good day, I’ve had a search but can’t find an answer to this. I would like to be able to add a horizontal price tool to a particular chart and have it automatically show on all the charts in the workbook. I have done this through other means such as copying the layers but it’s a bit laborious. Is there any way I can set the workbook to have horizontal lines show on all charts when placed on one?
Static tools like horizontal lines are kept on a per code basis, so if the codes in the workbook are all different they won’t appear. One alternative is to use a Show Plot tool with multiple outputs, it will be treated as a global tool and will appear on all codes.
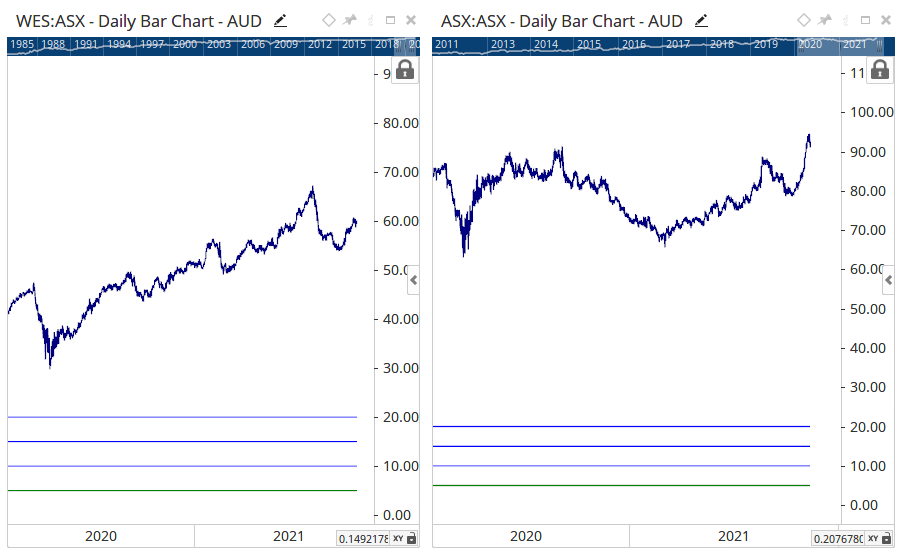
For example:
plot1 = 5;
plot2 = 10;
plot3 = 15;
plot4 = 20;
This would add Horizontal Lines at 5, 10, 15 and 20 for all codes using the same layout.
I coded a custom tool that draws customized rectangles (I draw a rectangle and the custom code draws another rectangle automatically) based on the price data specific to each ticker. But because it is a custom tool, it is also a global tool and appears on each chart under the same chart layout.
Is there a way to make this custom tool recognized as a static tool so that each set of customized rectangles drawn by the custom tool is stored for each layout.