Combine seasonality module and watchlist module together

Optuma Forums Optuma Feature Requests Combine seasonality module and watchlist module together

Viewing 11 posts - 1 through 11 (of 11 total)
  • Author
    Posts
  • #65831
    Yan
    • Topics: 25
    • Replies: 35
    • Posts: 60

    Hello everyone,

    Today when i was using optuma for seasonality research, i wonders if we can put seasonality chart and watchlist together , in this way it is more easy to identify favorate sectors on monthly basis.

    What’s your guys idea?

    Have a good day

    Yan

    #65835
    Matthew
    • Topics: 5
    • Replies: 677
    • Posts: 682

    Hi Yan,

    You can already have a Watchlist setup alongside a Seasonality chart, and have the chart update as you click on a code, is that what you were after?

    Ex1

    1 user thanked author for this post.
    Yan
    #65843
    Yan
    • Topics: 25
    • Replies: 35
    • Posts: 60

    Hi Yan,

    You can already have a Watchlist setup alongside a Seasonality chart, and have the chart update as you click on a code, is that what you were after?

    Ex1

    Hi Matthew, i can use the solution, but this is not what i am looking for.

    In fact, rather than using Optuma as a tool to make financial gains in the market, i use it to do research on sector rotation stuffs or seasonality studies even cycle fluctations, sometimes some reaches in the real world rather than digital numbers.

    So a solution like this would be rather helpful.  It gives us a overall look on how the market works directly.

    1728

    I know it’s a lot to ask…So i just want to ask, if there is any possibility to start such a project in the future. That would be a lot help for investing rather than trading chart.

    Thanks

    Yan

    #65845
    Matthew
    • Topics: 5
    • Replies: 677
    • Posts: 682

    Hi,

    When you open a Seasonality chart, there is an option on the left side Actions panel which allows you to Copy the raw values to Clipboard, which can then be pasted into Excel in a similar format to your example…

    Ex2

    This is on a per code basis, it can’t be done for a large list of codes at once.

    1 user thanked author for this post.
    Yan
    #65851
    Yan
    • Topics: 25
    • Replies: 35
    • Posts: 60

    Hi,

    When you open a Seasonality chart, there is an option on the left side Actions panel which allows you to Copy the raw values to Clipboard, which can then be pasted into Excel in a similar format to your example…

    Ex2

    This is on a per code basis, it can’t be done for a large list of codes at once.

    Hi Matthew,

    Yes, i do use this manually from time to time.  But it is not a permenant solution IMO.  Since i have over 150+ index and sometimes i do some research not only on sector basis, it becomes a enormal amout of work to me.

    So  i just proposed that using watchlist as a solution. It’s a little wired but there is a value in it in the long term.

    Just my opinion, waiting for your guys verdict. ~~

    Yan

    #65901
    Mathew
    • Topics: 41
    • Replies: 2,042
    • Posts: 2,083

    Hi Yan,

    The quick answer is no, that can’t be done.

    The longer answer is that a rewrite of the seasonality engine is on my to do list. Part of my ideas are to create scripts for seasonality.
    At this point I am way behind schedule on a number of projects, so I have no idea when I will get to this.

    All the best

    Mathew

    #65949
    Jeffrey A.
    • Topics: 57
    • Replies: 84
    • Posts: 141

    Hi Mathew,

    Just wanted to add something here in regards to seasonality..

    Since so much of the industry references quarters (q1, q2, etc) I feel it would be a useful addition to have in the seasonality module the option to display “quarters” in addition to weeks, months, etc.  I currently have found ways to use the signal tester to produce similar results to gather data for specific quarters but it would handy to have the quick ability to do this in the seasonality module. Further, a “QuarterNum”() type function (1,2,3,4) would also be useful and save some time for scripts as well.

    Jeff

    #65955
    Mathew
    • Topics: 41
    • Replies: 2,042
    • Posts: 2,083

    Hi Jeff,

    I’ll log those suggestions for the devs to have a look at when we are next in those areas.

    All the best

    Mathew

    #65965
    Yan
    • Topics: 25
    • Replies: 35
    • Posts: 60

    Hi Yan,

    The quick answer is no, that can’t be done.

    The longer answer is that a rewrite of the seasonality engine is on my to do list. Part of my ideas are to create scripts for seasonality.
    At this point I am way behind schedule on a number of projects, so I have no idea when I will get to this.

    All the best

    Mathew

    Hi Mathew,

    Take your time. I am not seeking immediate solution. Generally i just bring up a question and looking for an solution in the next 2-5 years.

    If you say that you will take it under consideration then it’s good enough for me.  We can return to the question later when you and your team have more time to discuss the project.

    I know that you guys are busy focusing on the 2.0 version. We will talk about this later.

    Best wishes.

    Yan

    1 user thanked author for this post.
    #65969
    Jeffrey A.
    • Topics: 57
    • Replies: 84
    • Posts: 141

    Hi Mathew,

    One more request for seasonality:

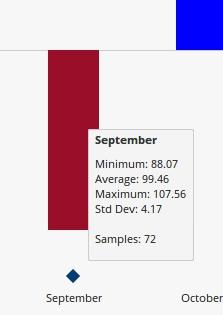
    Can we add more statistics in the info box?
    seasonality snapshot
    Specifically showing  1) # of UP occurances  2) # of DOWN occurances 3) %’s would be helpful too to compliment the first two,  (ex: Down 50 of 72 samples, 69.4% of time), 4) and perhaps any other stats like the median, etc..

    Jeff

    1 user thanked author for this post.
    #65971
    Mathew
    • Topics: 41
    • Replies: 2,042
    • Posts: 2,083

    I’ll add it to the list!

    1 user thanked author for this post.
Viewing 11 posts - 1 through 11 (of 11 total)
  • You must be logged in to reply to this topic.

Pin It on Pinterest