Compare Years

Hi,

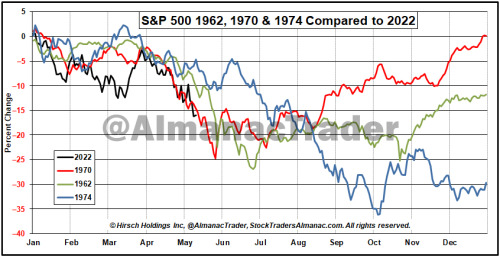
I want to plot SPX during the year 1970 and then overlay this year’s year-to-date performance. Please see the attached picture 1.

Do I do that through seasonality? I have a seasonality chart with the Draw Style set to components. If this is correct, how do I remove the other years?

thank you.

O1jpg.jpg

Hi,

I think the Historical Comparison chart is closer to what you are after rather than Seasonality. You can see further information here:

https://help.optuma.com/kb/faq.php?id=986

This is closer. Is there a way to limit the data so I just see 1 year? I want to start at 01/01/1970 and end at 12/31/1970?

Hi,

Yes, in the charts properties is a value for Trim Style, adjust this to Fixed Length - 1 Year and the chart should appear as per your example image.

Ex3

Perfect Matthew! Last question I’ll bother you with, is there a way to change the x-axis so it is either month numbers or names instead of days?

Hi,

Not currently, the charts x scale looks to be locked to a trading day bar count and it can not be adjusted to display alternative options at this time.

Thanks so much for walking me through this.