Hi Everyone,
is it possible to have Historical Comparison Chart from the values of a Custom Code Column of a Watchlist?
Usage: The custom script column would show for example the MA (Moving Average of the Code). The Comparision Chart would now show the graphs of the MA’s (which is smoother to compare).
Hi Max,
Try the Script chart which will show the values of any tool or indicator in a time series: https://help.optuma.com/kb/faq.php?id=945
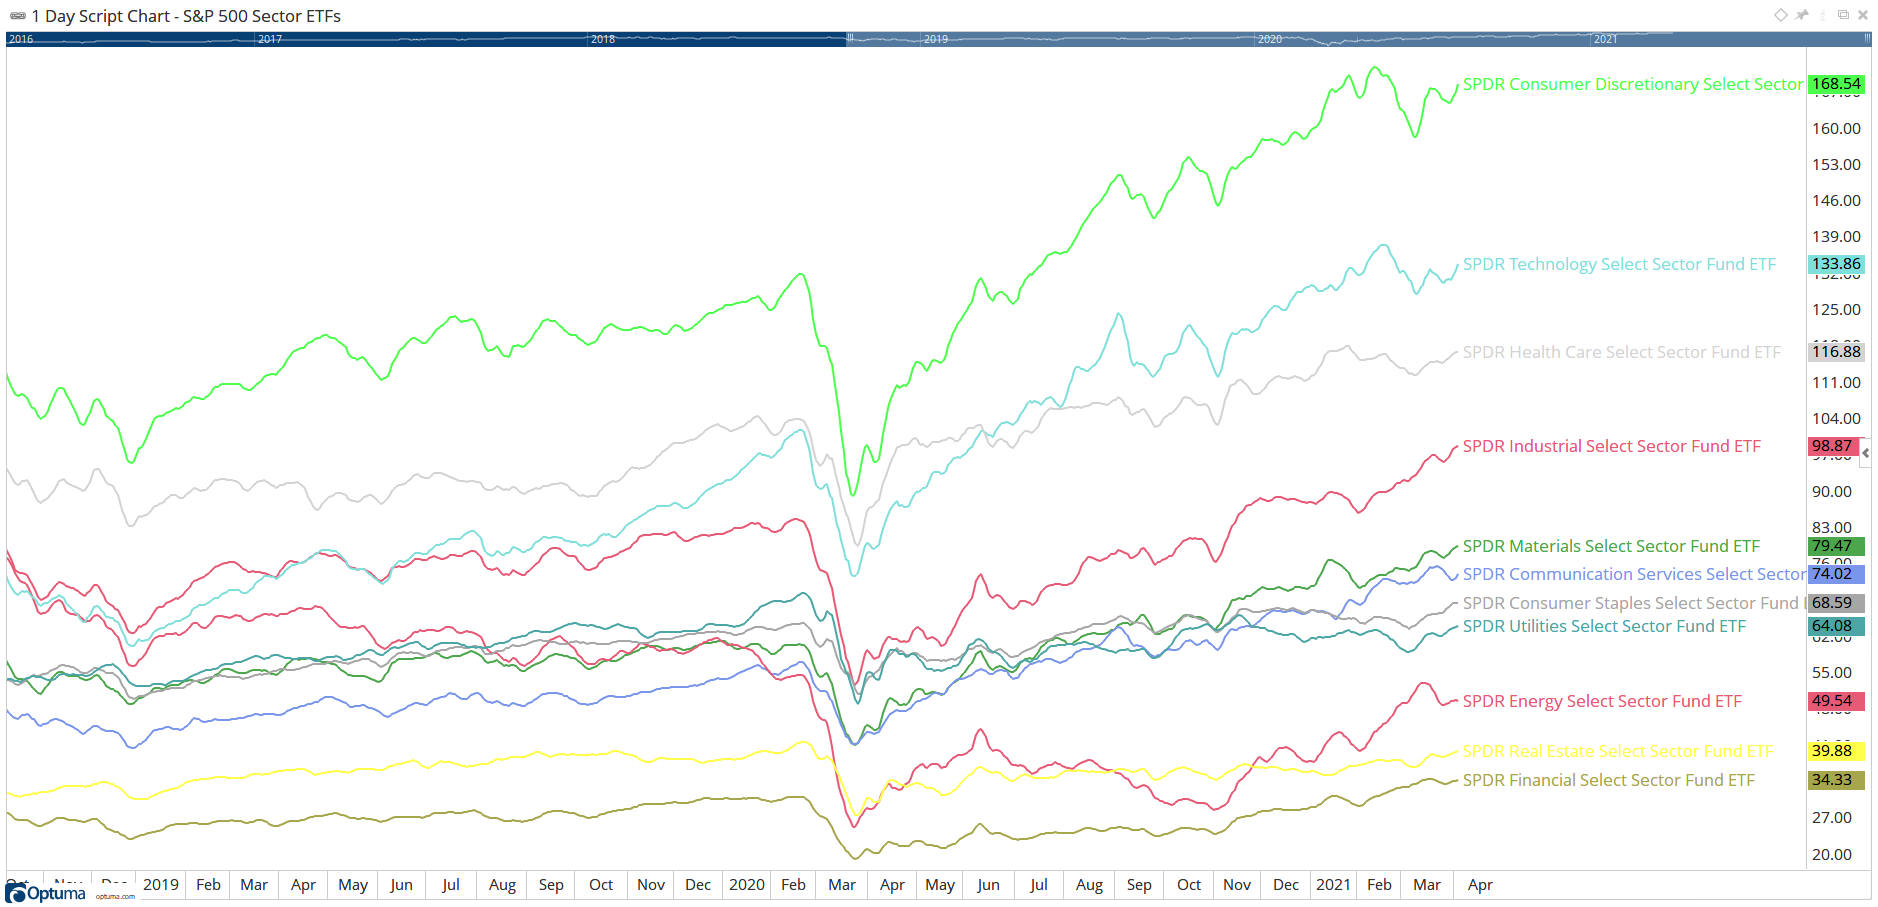
Here’s the 5 period moving averages (MA(BARS=5)) of the S&P 500 sector ETFs:
Hi Darren,
great, thank you. The Script Charts seem not to work with the Crosshairs Funktion (unlike the other charts). Is there a way to activate crosshairs in script charts?