I’m looking for some direction on how to script a composite model of 5 technical indicators. Each indicator would be scored +1 (pos) or -1 (neg). Examples might be:
BPB (Bollinger Band) % B(20,2)
Where any reading of 1 or greater would receive a +1(Pos) and readings below 0 would receive a score of -1(Neg).
BPB(BARS=20) (Not sure where to go after this)
Normalized ROC(10)
I’m assuming this would be the proper script.
// TO CALC NORMALIZED 10 DAY ROC
//CALC IS 10 DAY ABSOLUTE PRICE CHANGE / ATR(10)
// ABS 10 DAY PRICE CHANGE
V1 = (CLOSE()-CLOSE(OFFSET=10));
// ATR(10)
V2 = ATR();
V1/V2
Where reading of +3 or greater would receive +1 (Pos) and reading of – 3 or lower would receive -1(Neg).
After scouring the script forum, my guess is that after all 5 indicators have been scripted the last line of the composite script would read:
V1+V2+V3+V4+V5 // To get composite score.
If someone could get me started on a proper script format, I should be able to figure out the remaining indicators (assuming that all the indicators are scripted roughly the same)
I have been through all three levels of the scripting courses. I do understand the basic Boolean 1 or 0 (True or False) tests for a ranking system. However what I’m looking for is scoring system that, depending upon what the numeric value of the technical indicator is, would rank each of five technical indicators +1 or -1. The total score for the composite model would run +5 (all indicators bullish with a +1 reading) to -5 (all 5 indicators bearish with a -1).
Another example (using two of the five indicators):
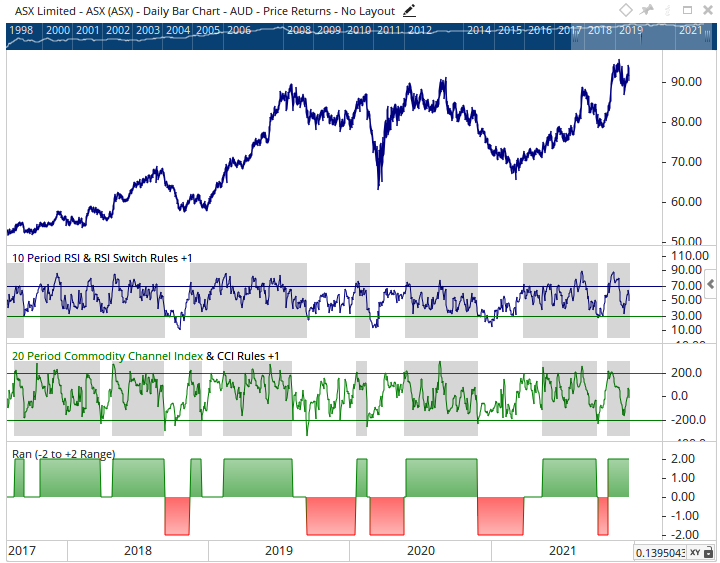
RSI(10)
Rules for the indicator
If RSI(10)>= 70 then the indicator score would be +1. It would stay +1 until the indicator fell to <= 30 in which case the score would flip to -1.
If RSI (10)<= 30 then the indicator score would be -1. It would stay -1 until the indicator rose to >= 70 in which case the score would flip to +1.
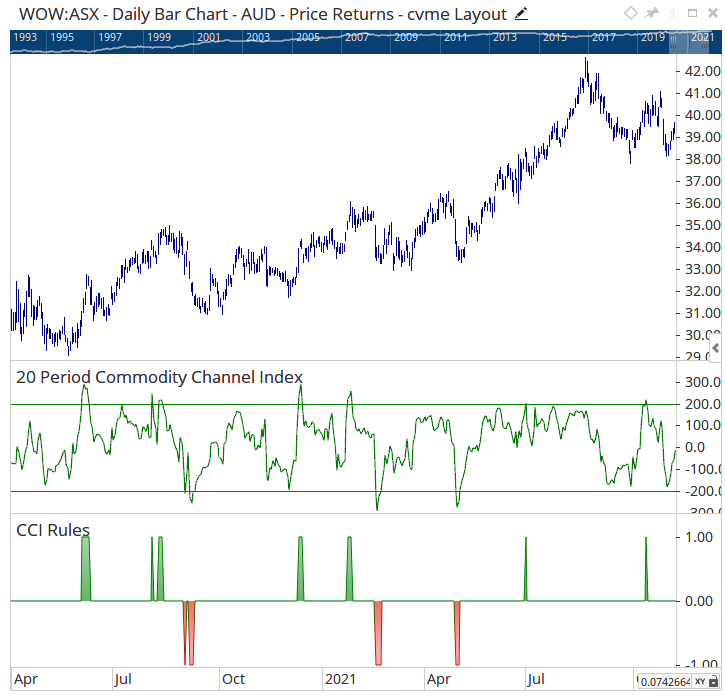
CCI(20)
If CCI(20)>= 200 then the indicator score would be +1. It would stay +1 until the indicator fell to <= -200 in which case the score would flip to -1.
If CCI(20)<= -200 then the indicator score would be -1. It would stay -1 until the indicator rose to >= 200 in which case the score would flip to +1.
These are example of the basic parameters of each indicator. It seems to me that such a script would contain elements of an IF Statement and or perhaps a Switch(). I’m just unsure of how to construct the script for each indicator and sum them up. Any clues would be appreciated.
P.S. I know this model can be created. What I’m looking to build is a variation on a model that Arthur Hill had created using Optuma. Tip of the hat to Arthur.
After further research on this model. It appears that in addition to the scoring parameters of:
If indicator value crosses above +200 = +1
2 If indicator value crosses below -200 = -1
There is a third parameter where:
3. If indicator value is < +200 and > -200 then = 0
Here is the script from just one indicator to use as an example. This code works fine for defining parameters 1 &2.
// TO SET INDICATOR CCI1 = CCI(BARS=20); // TO SET PARAMETERS FOR INDICATOR CCI2 = CCI1 CrossesAbove 200; CCI3 = CCI1 CrossesBelow -200; // TO INTRODUCE SWITCH AND IF STATMENT CC14 = SWITCH(CCI2,CCI3); RES3 = IF(CCI4 ==1,1,-1);
The trouble comes when I try to introduce parameter #3. I’ve tried a nested if statement that looks like this:
// INDICATOR 3 CCI(20) (+200,-200) // TO SET INDICATOR CCI1 = CCI(BARS=20); // TO SET PARAMETERS FOR INDICATOR CCI2 = CCI1 CrossesAbove 200; // +1 INDICATOR SCORE (BOOLEAN) CCI3 = CCI1 CrossesBelow -200; // -1 INDICATOR SCORE (BOOLEAN) CCI4 = CCI1 < 200 and >-200; // 0 INDICATOR SCORE (BOOLEAN) // TO INTRODUCE SWITCH CCI5 = SWITCH(CCI2,CCI3); // TO SCORE INDICATOR +1, -1, OR 0 RES3 = IF(CCI4==1,0,IF(CCI5==1,1,-1))
No matter how I write the Nested if statement where IF(Test Condition,Then, Else) I receive an invalid Script statement from the Script manager. Is the Switch Function necessary? Any clues would be appreciated.
Working on a different model that includes Keltner channels and Bollinger Bands. I need to set bull +1 and bear -1 conditions on crosses above and below the upper and lower band and channel lines. Here’s what I have now (I pretty sure it incorrect as the compiler won’t accept it).
// BOLLINGER BANDS (125,1) BULLISH (+1) ON UPPER BAND CROSS, BEARISH (-1) ON LOWER BAND CROSS BB1=BB(BARS=125, STDDEV=1.000000); // TO SETUP BULL BEAR PARAMETERS BB2=BB1 CrossesAbove BB(BARS=125, STDDEV=1.000000); BB3=BB1 CrossesBelow BB(DEFAULT=LowerLine, BARS=125, STDDEV=1.000000); // TO SETUP SWITCH AND IF STATEMENT BB4=SWITCH(BB2,BB3) RES2=IF(BB4==1,1,-1);
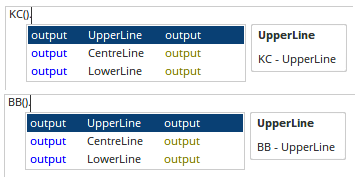
My question is, is there dot notation that can be used to delineate the upper and lower channels and bands or is there another way?
Yes, both the Keltner Channel and Bollinger Band script functions include dot notations to select the value you wish to reference (Upper, Central or Lower lines)…