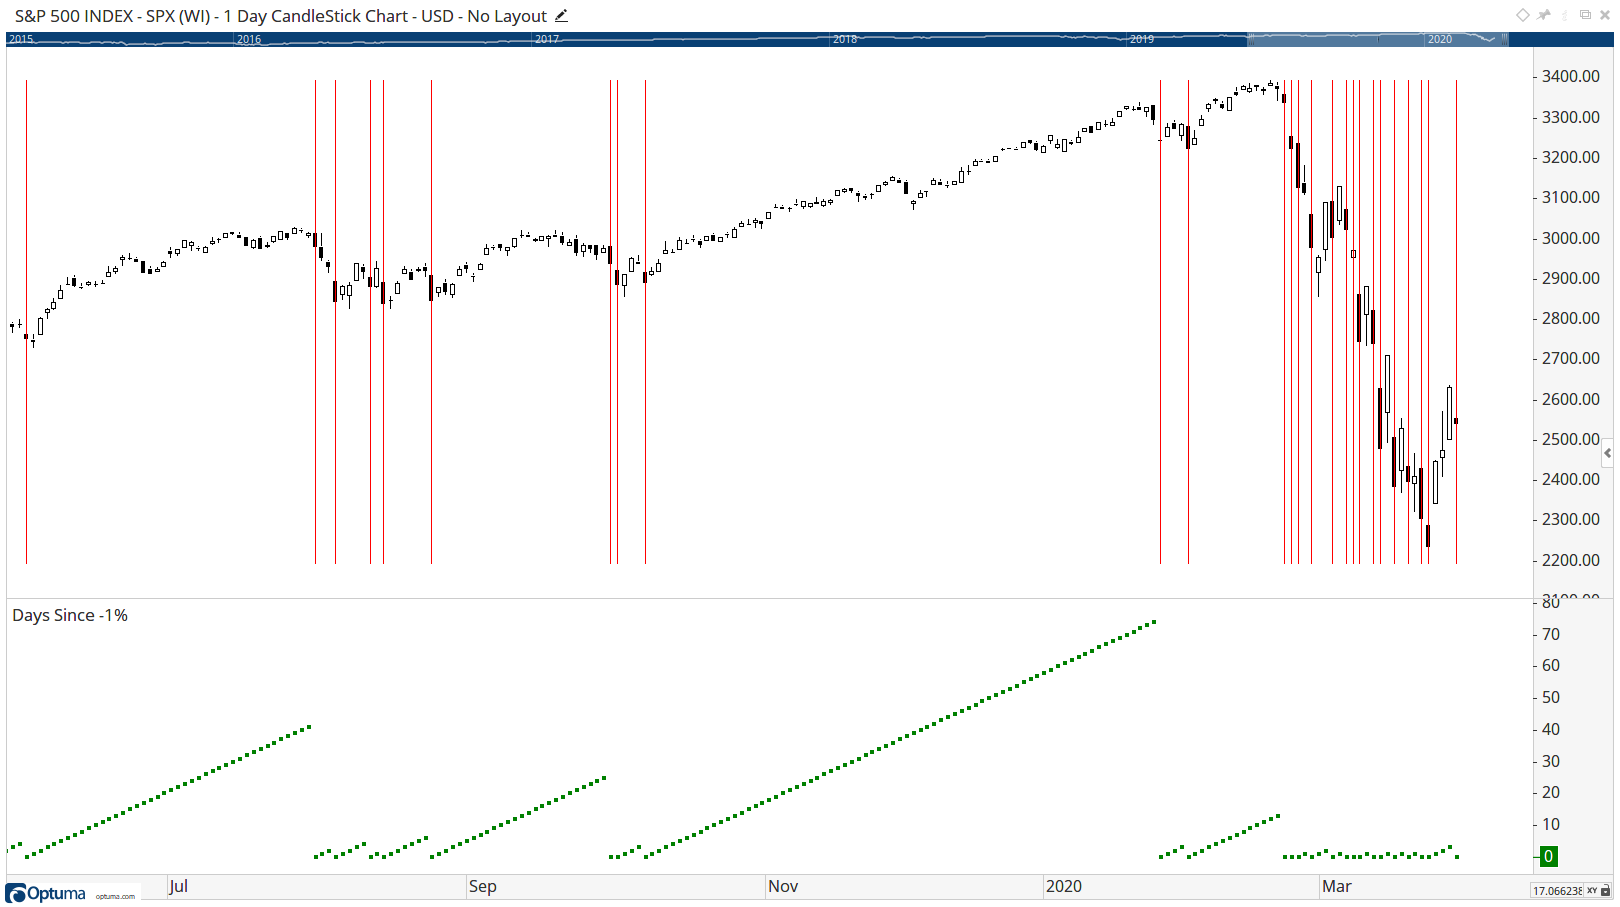
Concerning the S&P 500, between 2019/10/08 and 2020/01/26 we had 74 consecutive trading days without a 1% decline. The 1% declines were on 2019/10/08 and on 2020/01/27.
I want use the script in a watch list and use the Show View tool to display the time period we had no 1% decline.
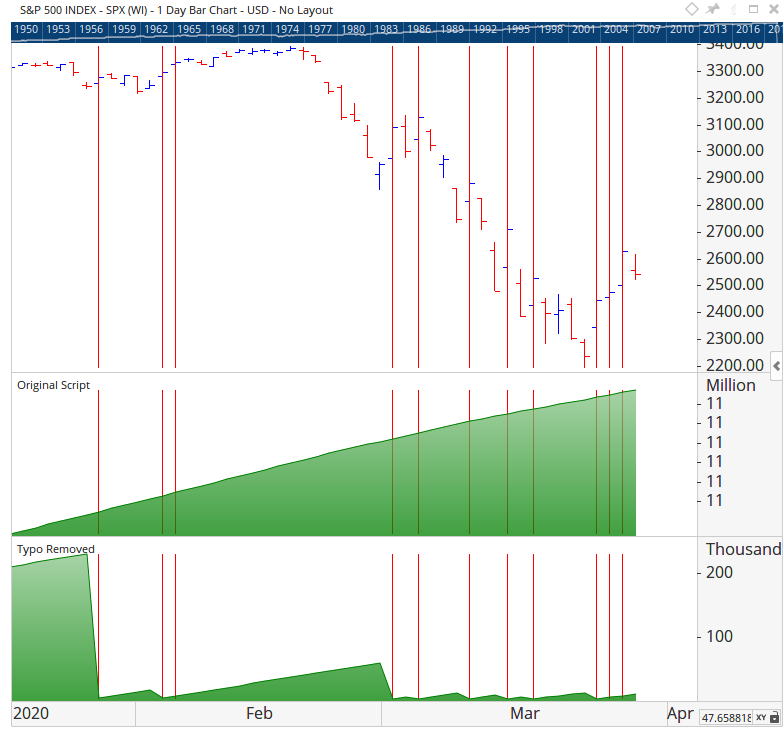
But anyway the script does not what I want. The script seems to count the 1% days from the beginning of the data file.
I want some sort of count reset so that the script counts each period we had consecutive trading days without a 1% decline separately.
As in my first post mentioned we had 74 consecutive trading days without a 1% decline between 2019/10/08 and 2020/01/26. I “want” the number “74” and not a cumulative total since the start of the data file.
I am here again. It seems that I was in some way not as clear as I thought I am.
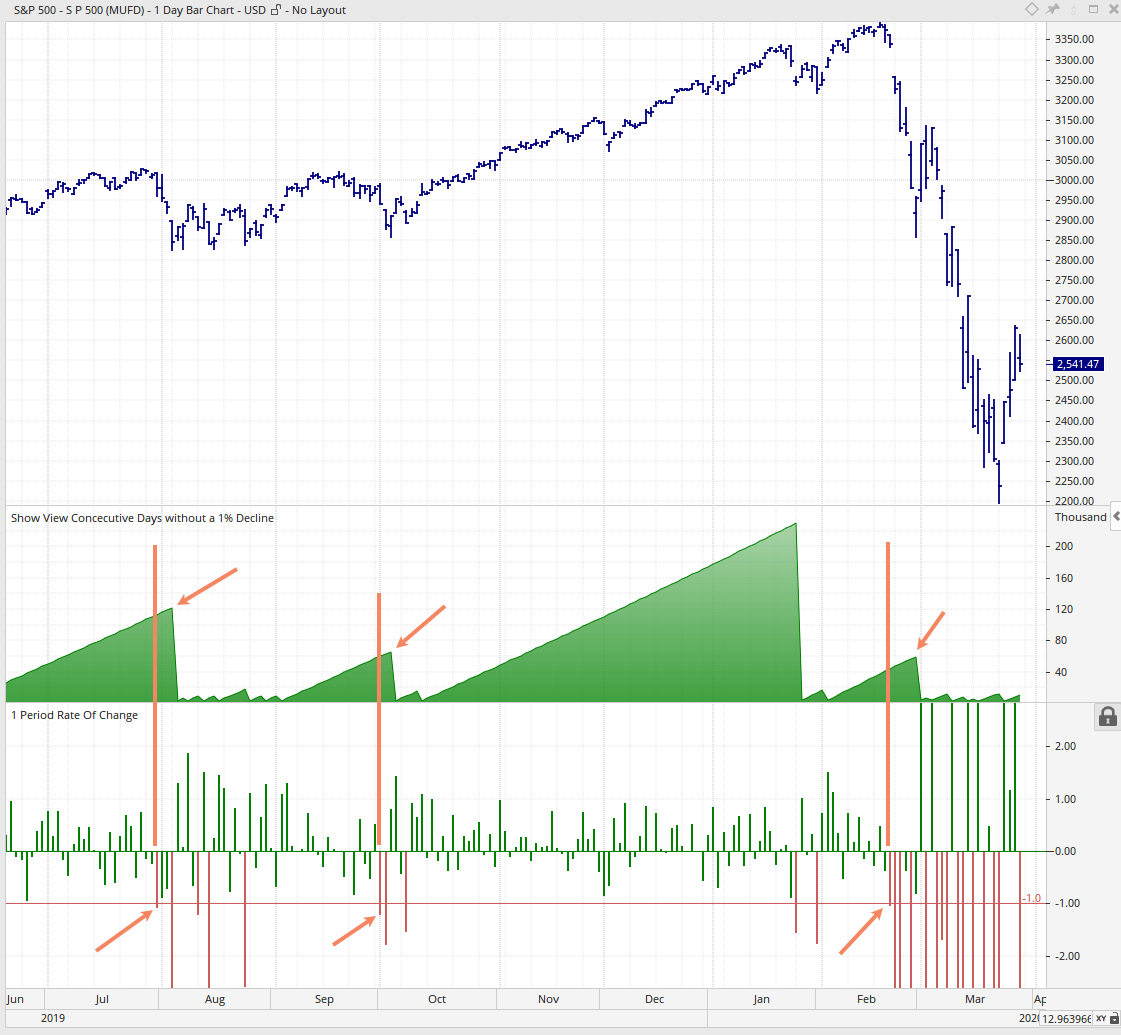
Concerning the reset, it should be done on the first day we had a decline of at least 1%. The script above seems to ignore some of the minus 1% declines. See my screen shot.
I have created a 1 day ROC with the histogram colored in red when we had a decline of at least 1%.
As you can see some of the script counts do ignore some 1% declines.