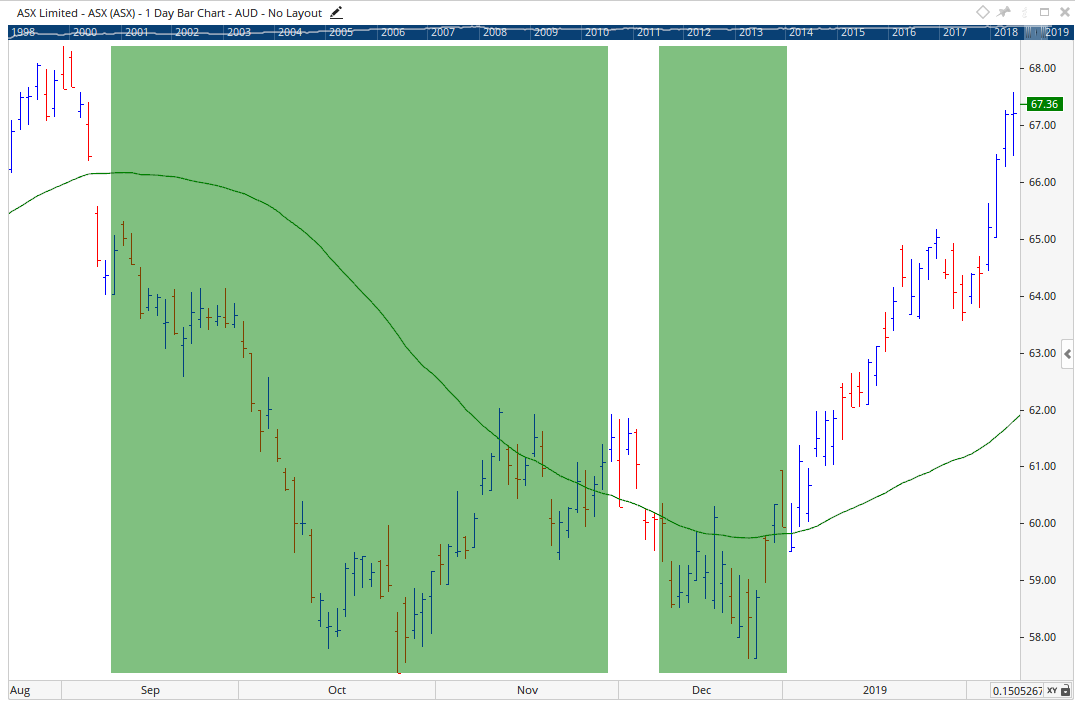
I'd like to able to define a continuous period of time (or a date region) using script only. The start and end of the date region are each based on their own specific conditions. All bars in between the start and end evaluate to true. Such a concept could be used to define a bear market for example. Skeleton pseudo code as follows:
MovAvg = MA(BARS=9, CALC=Close);
StartCondition = CLOSE(0) < MovAvg[0] and CLOSE(1) < MovAvg[1];
EndCondition = CLOSE(0) > MovAvg[0] and CLOSE(1) > MovAvg[1];
BearMarketStart = StartCondition;
BearMarketEnd = SIGNALAFTER(BearMarketStart, EndCondition);
isBarInBearMarket = IF(Bar is between BearMarketStart and BearMarketEnd, TRUE, FALSE);
Has anyone done something similar? The above correctly defines the BearMarketStart and BearMarketEnd variables, but fails in that the isBarInBearMarket variable only evaluates to true for one bar after BearMarketStart even though there might be a dozen or more bars between BearMarketStart and BearMarketEnd.
Many thanks in advance for any ideas or assistance.