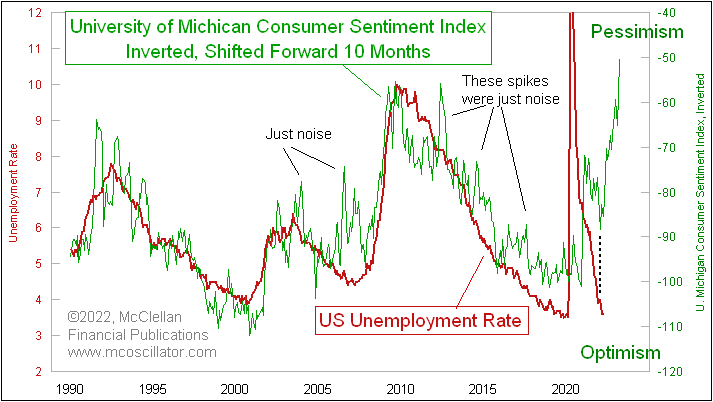
I would like to understand how to interpret the Cross Correlation Tool better. The knowledgebase post has not been enough for me, sorry. Please see the attached picture called “original.” The analyst posted this saying the green series leads the red series by about 10 months. I want to verify his claim. I’ve recreated his chart in Optuma and added a Cross Correlation Tool. It is attached and called “remake.”
Looking 10 months to the left, the Cross Correlation tool reads .53 which is a moderately strong positive correlation. To me this means that the analyst is right, there is a moderately strong correlation between the green series now and the red series 10 months ago. Am I reading the tool correctly?
What about looking to the right of the center line? I’ve labeled the bar .80. How do I interpret this in words? There is a very strong correlation between the green series now and the red series in 10 months? We don’t have the data for future months yet. Please help me to understand how to understand what this tool is showing.
Hi. I am very interested in the cross correlation tool. I understand it helps explain if one security leads or lags another. I just don’t understand how to interpret the tool.
Please see the attached chart. I can visually see the blue line peaks ahead of the black line though not on the way up from the March 2020 low. I can see there is a .5 correlation, so a moderate one, 21 weeks ahead and 22 behind. Please help me to interpret what this tool is saying about the relationship of the second security in blue to the first security in black.
Markets are very fluid and adaptive. There are many inputs into what causes prices to move from economic to fundamental to behavioural. While Cross-Correlations can be helpful, my concern is that we do not know if the relationship is causal or a random correlation.
Because of the above, what we see is that markets tend to be correlated (even with a lead/lag relationship) for a season and it dissipates. Why? I’m not sure, there is an element of truth to market efficiency where technical opportunities tend to be arbitraged out. You’ll remember from CMT3 course that this was my biggest contention with the correlation chapters. The author presented the relationships as immutable where, as the image shows below, they are seasonal.
To offset item 2, correlation and cross-correlation studies should be limited to around 12 cycles. This is common in cycles analysis as periods before that just introduce noise etc.
Most correlation studies use percentage change as the input. This is something that I have concerns about since it does not allow for differing volatility. Eg in a correlated move, a low priced stock may fall 10% and a high priced stock fall 5%. How significant those falls are can only be determined when we compare to the volatility of each of those stocks. IMHO, correlation studies should be performed on volatility-adjusted data (something I want to introduce when I get time).
All of that is to caution about correlations. They are very interesting but have their limitations. One leading another simply tells us that there is a good chance that a similar turn will be seen x weeks later.
In your chart, the inverse correlation at 18 weeks is interesting. a value at 0.8 is significant. I would limit the data on the chart to 12 x 18 weeks (216) to try to reduce the noise and see if it holds.