Hi,
If you have 100 dates you want to mark, and want the ability to add / remove dates (without needing to reapply the lines manually), i would suggest using a CSV file.
Setup a CSV with all the dates you wish to mark in one column, and a 1 as the second, so it looks like this:

Once you have all dates listed in the CSV file, save it (making sure the dates are all using the same dd/mm/yyyy) format. Once saved, import it into Optuma using the steps outlined here: https://help.optuma.com/kb/faq.php?id=672
Once imported, open the chart, setting the properties to Date, Close when prompted.

Once open the chart will look odd, but we will have what we need to be able to plot the dates on other charts.
To do this, open the chart you wish to see the lines on, and apply a Show Bar tool: https://help.optuma.com/kb/faq.php?id=719
Adjust the script so that it uses a GETDATA() function to reference the CSV you just imported. Once done all you need to do is add a Boolean to look for instances where it is greater than zero. Here is my example:
V1 = GETDATA(CODE=ExampleDates:CSV 1) ;
V1 > 0
You can then adjust the Show Bar tool to display as Arrows or Lines.
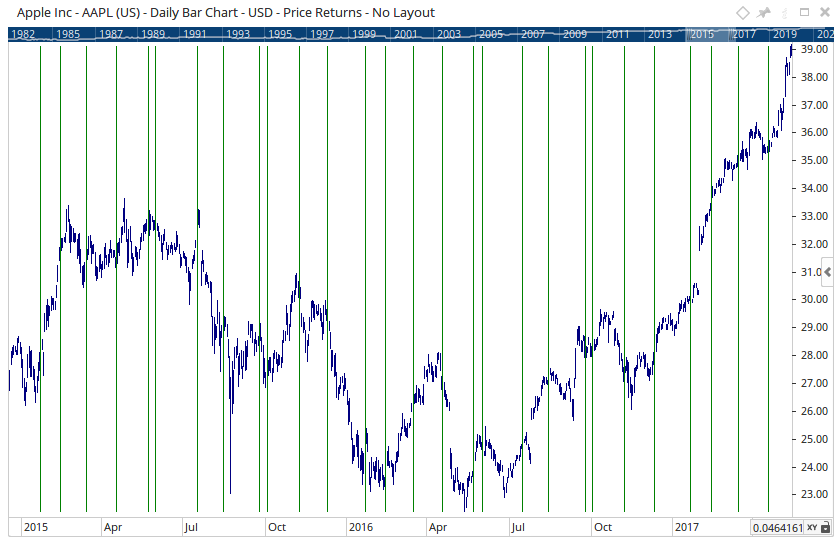
Finally, for quick access in the future you can add the Show Bar indicator to your custom tool bar, which can then be used to add the same dates to other charts.
If you want to add / remove any dates to the list, simple edit the CSV. When you re-open the charts the adjustments will be applied automatically.