Optuma’s custom Market Breadth module allows clients to create their own breadth measures. For more info on this module see here.
In this Tweet we counted the number of times the members of the S&P500 index crossed above and below their 200 day moving average. This was done by creating two symbols under Data > Market Breadth in Optuma. One was called SPX200XA for crossing above:
CLOSE() CrossesAbove MA(BARS=200, CALC=Close)
And SPX200XB for crossing below:
CLOSE() CrossesBelow MA(BARS=200, CALC=Close)
The IsMember function was also included so that survivorship bias-free data was used (more on that here). The number of crosses were counted for each day over the last 10 years:
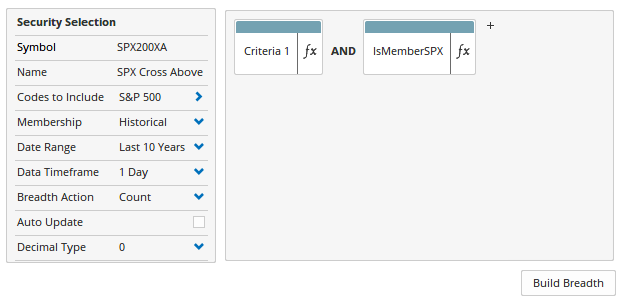
Once created, click the Build Breadth button and the symbol will be added to your system, and you will then be able to open the charts like any other.
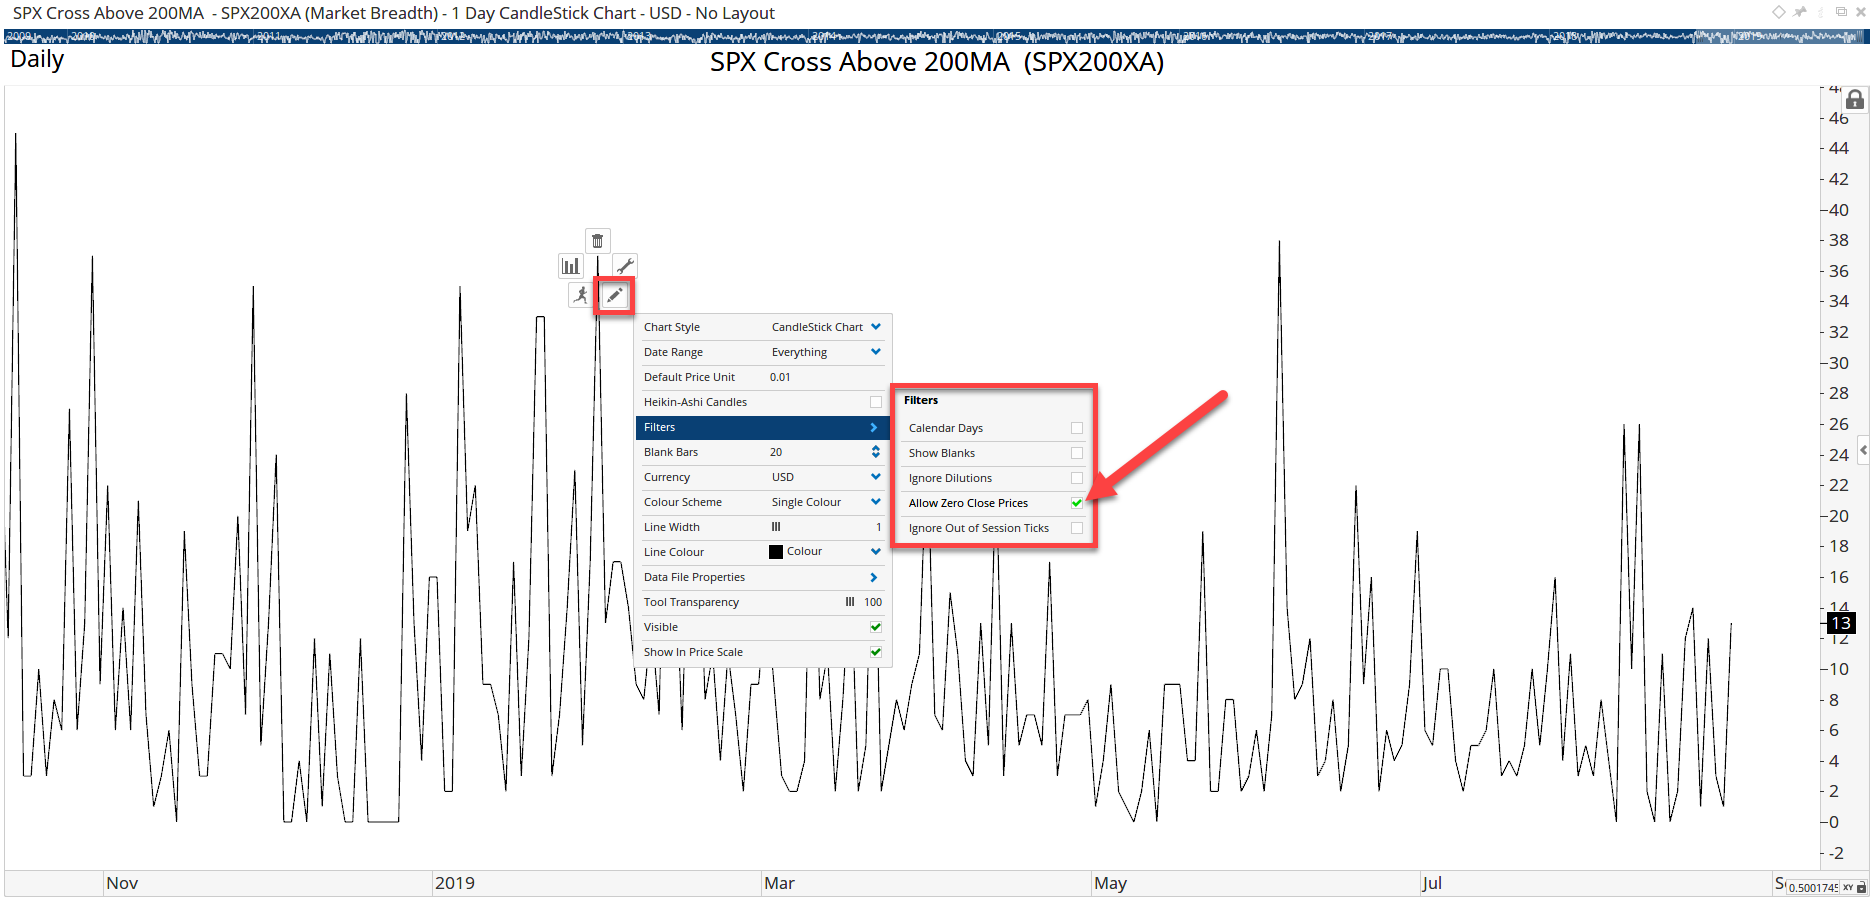
NOTE: by default Optuma will not plot data with a value of zero, and seeing as there will be days when there are zero crosses of the 200MA you will need to ensure that the Allow Zero Close Prices option has been enabled under the Filters property:
Clients with the custom Breadth Module can save the files (used to calculate the above counts) here:
Documents/Optuma/Local/Breadth
They will then be available under the Data > Market Breadth menu to be calculated.
SPX-Cross-Above-200MA.obe (1.27 KB)
SPX-Cross-Below-200MA.obe (1.27 KB)
