Hi,
I think the "Cycle Tool" needs some more improvements. On your web site (https://help.optuma.com/kb/faq.php?id=310) describing the "Cycle Tool" you write the following:
"... The Cycle intervals can be dynamically adjusted by left-clicking and dragging an interval line.
Previously, it was only possible to establish a single interval sequence which was determined by the position of the start and end anchor lines. Now it is possible to move the 1st Interval line (after the start and end lines) and reposition it to create a second interval in the sequence. This process can be repeated with the subsequent interval lines resulting in the tool displaying multiple interval periods."
This description is very promising!
BUT in the real world is looks a little different. The issue is the EXACT REPOSITION of the interval lines to create
multiple interval periods AND the EXACT CALCULATION of the interval time periods.
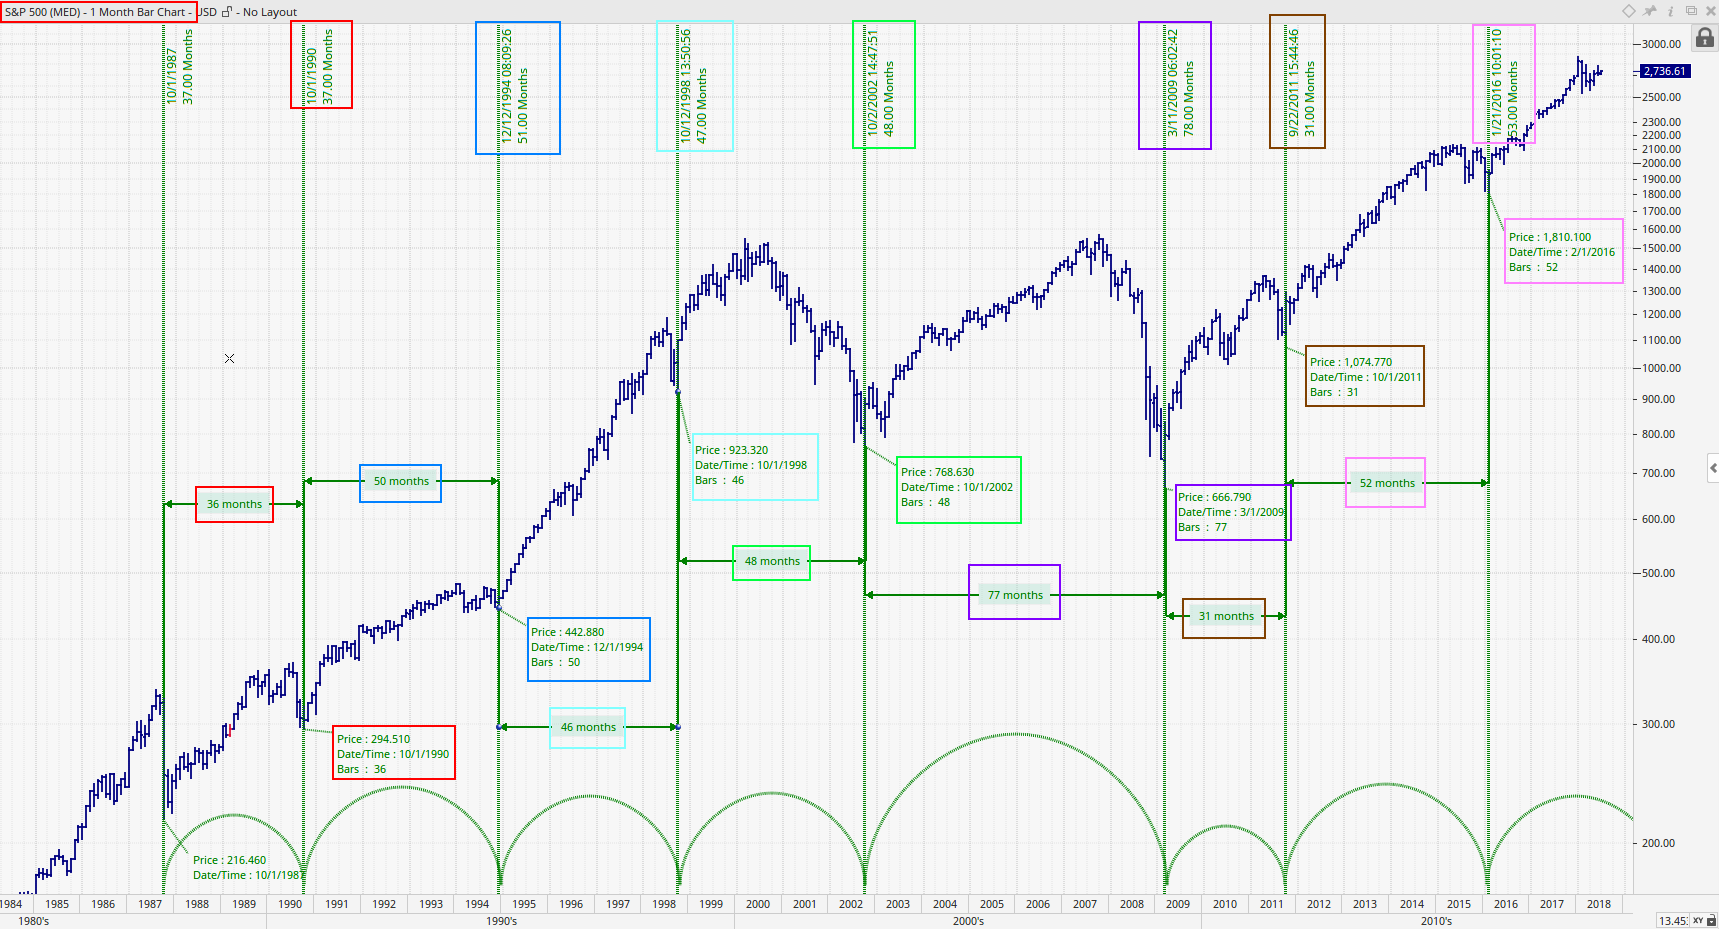
I have attached a screen shot (Cycle Tool Issue.png) to visualize the issue much better. As you can see from the screen shot I use monthly data.
Although I use monthly data, that means each bar has as date the first day of the month, e.g. 10/1/1987, 10/1/1990, 12/01/1994 etc. the Cycle Tool uses different dates, e.g. 12/12/1994, 10/12/1998, 10/02/2002, etc. and it uses even a time value on monthly data!!!
You can also see from the screen shot the Cycle Tool calculates in most cases different time periods of the interval periods than the "Time Measure" tool and the "Time Price Label" tool. That is NOT acceptable!!!
The Cycle Tool MUST calculate the SAME time periods of the interval periods as the "Time Measure" tool and the "Time Price Label" tool. That is obvious, isn't it.
The issue with the Cycle Tool seem to be the EXACT REPOSITION of the interval lines to create multiple interval periods and perhaps some "internal" programming procedures.
When I use e.g. monthly data than the date of the monthly bar must be used and not an artificial date, e.g. 12/12/1994, 10/12/1998, 10/02/2002, etc. and a time value is completely unnecessary.
When I use the "Time Measure" tool I click the first point and then move the mouse over the bars and the bar over which the mouse is currently is highlighted and if the highlighted bar is the correct one I made the second click and the "Time Measure" is displayed and calculated.
When I use the Cycle Tool no bars are highlighted when I REPOSITION the interval lines to create multiple interval periods. That makes the reposition not very easy and exact.
My first recommendation there is to highlight the bar the mouse currently is over as in the "Time Measure" tool to be able to choose the correct bar to make an excact reposition of the interval lines.
My second and most important recommendation is to use the dates of the bars and NOT some artificial dates. The time value is of no use for daily, weekly, and monthly data. The time value information can therefore be completely removed from the Cycle Tool if one use daily, weekly, and monthly data.
I hope I was able to clarify my issue with the Cycle Tool and hope of course the my recommendations are implemented in the near future.
Thanks again for your attention and your great program.
Thomas