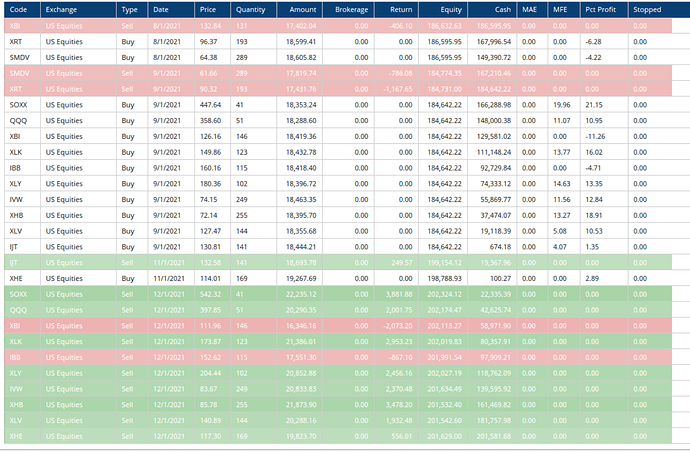
In running a backtest, when I compare the prices of trades listed in the backtest with the actual prices on the charts, there is a mistmatch. For example, the first line in the attached file shows XBI sold at $132.84 on 8/1/21. The price range that day (actually Monday, 8/2/21) was $123.06 to $125.80. Is there a reason for this?
Hi,
Without seeing the specific back tests properties i can only make a guess, however It looks like your back test is being run on Monthly data. Change your charts time frame to 1 Month and you will see the monthly bar for August 2021 has a closing price of $132.84 (last close of the month when viewing a daily chart).
That is where the price is coming from.
If you want to run the back test as if it were on a daily chart, change the Back Tests time frame to Daily.
