Hello, I am trying to do a backtest using the Divergence tool to show positive divergence between Price and a 13 period RSI but having a difficult time. It is not identifying all trades and is taking some trades that are not indicated. I have gone through all of the tutorials but I am still having trouble determining the coding syntax and what is returned. The exit criteria is the same except for type = negative, however it’s closing the trades on positive divergence and ignoring the negative divergence. Thank you.
//Variable for price
x1 = CLOSE();
//Variable for RSI
x2 = RSI(BARS=13);

//Divergence Tool
DIVERGENCE(x1, x2, BARS=6, type = positive)
The Divergence() function doesn’t have a Type field to reference. The way it works is a result of +1 is a positive divergence and -1 is a negative divergence.
If you wanted to buy for a positive divergence you could use:
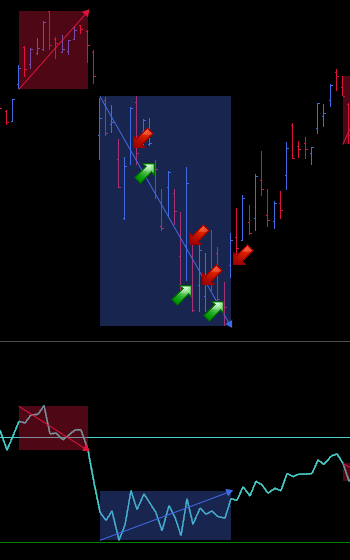
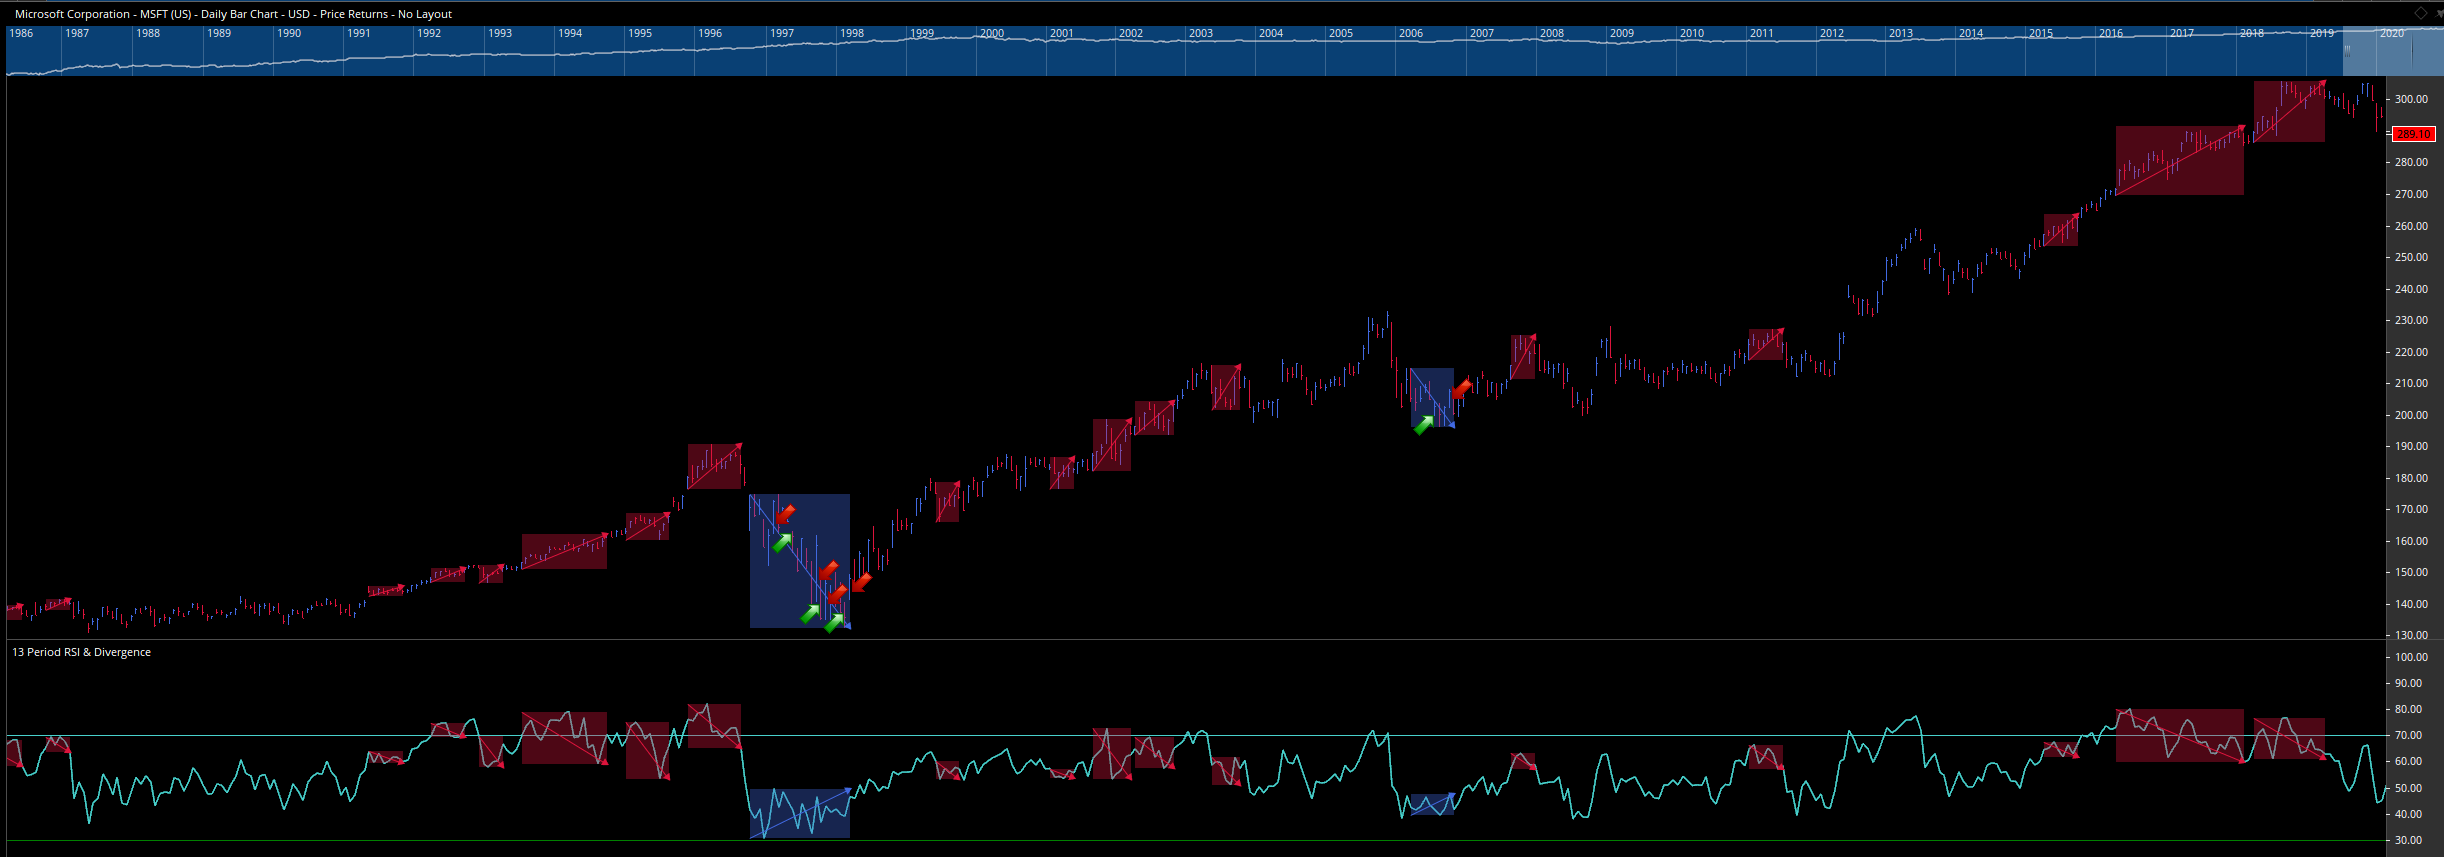
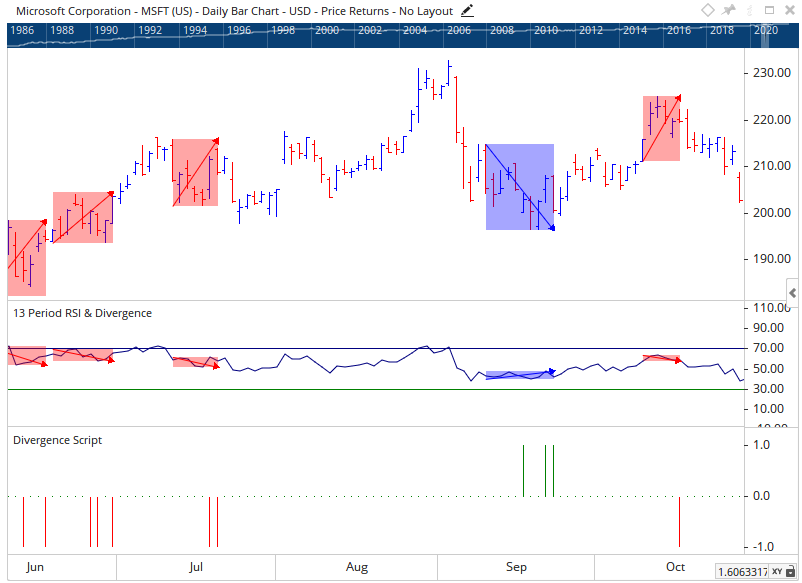
If you apply a divergence script via a Show View along the bottom of the chart you will see where it is triggering for positive / negative divergence. Not every bar in the shaded zone will be a match, to see why i’d recommend viewing the chart with training mode, you can see how the zones build as new data comes in).
Thank you Matthew, I appreciate the quick response and insight. Just a follow up question, how do I tell what fields a function returns. I know some of them are listed using the dot script but some either do not list anything or have fields not listed?
I saw a reference of a white paper on scripting but when I clicked the link an error message was returned.
Either using the dot notation or clicking on the function text will show you the outputs available under Default Plot, eg for MACD:
The divergence function is different in that it’s a true / false signal so you will see the output values (+1 / -1) when using it in a Show View as per Matthew’s example above.
As for the whitepaper please send the link to support and we’ll get it fixed. If you haven’t already done so, I’d highly recommend the 3 scripting tutorial courses available when signing in here: