I’ve looked through tools and can’t find anything that resembles the Double Exponential Moving Average I am looking for, so I am hoping you can help write a script for me to use in my analysis.
To calculate the DEMA I think you need to:- identify the look-back period and the EMA(n). I would like the look-back period to be 15 days, and calculate the EMA for that period, which becomes the EMA(n). Then I need to apply an EMA with the same look-back period as the EMA(n), which again will be 5, which I am hoping will give a smoothed EMA. The script then needs to multiply the EMA(n) by 2 and subtract the smoothed EMA.
How to Calculate the Double Exponential Moving Average (DEMA)
Choose any lookback period, such as five periods, 15 periods, or 100 periods.
Calculate the EMA for that period, this is EMA(n).
Apply an EMA with the same lookback period to EMA(n). This gives a smoothed EMA.
Multiply two times the EMA(n) and subtract the smoothed EMA
So basically the formula for the Double Exponential Moving Average (DEMA) should reflect this:
DEMA=2 x times EMA(n) - EMA of EMA(n) where n=Look-back period.
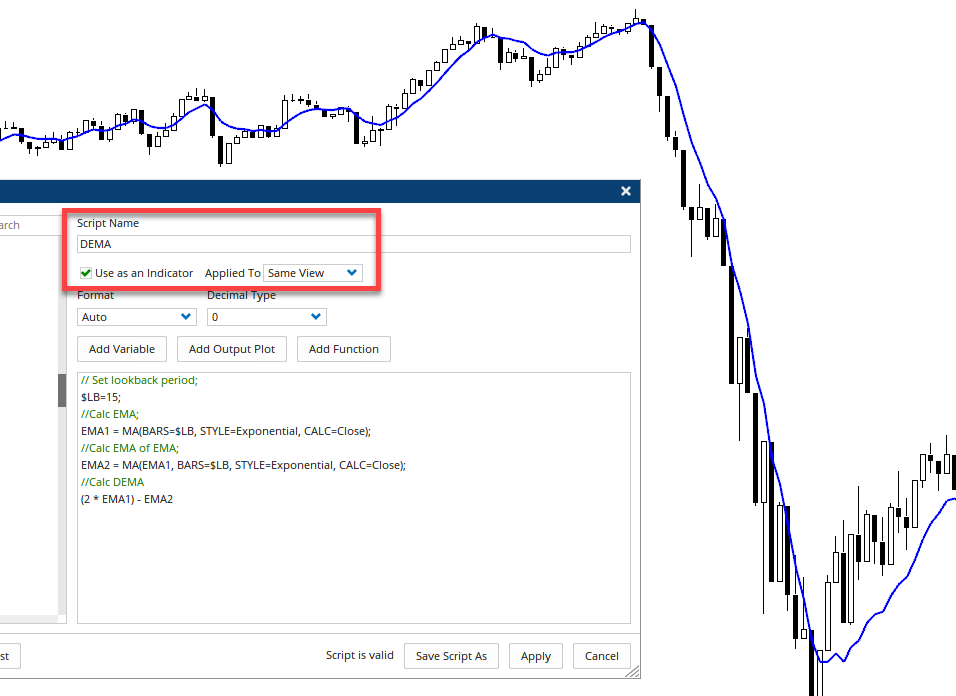
You start by calculating the EMA and then nest that in the 2nd EMA. Use this formula in a Show Plot (to adjust the lookback period change the #$LB variable from 15 to eg 34).
// Set lookback period;
#$LB=15;
//Calc EMA;
EMA1 = MA(BARS=$LB, STYLE=Exponential, CALC=Close);
//Calc EMA of EMA;
EMA2 = MA(EMA1, BARS=$LB, STYLE=Exponential, CALC=Close);
//Calc DEMA
(2 * EMA1) - EMA2
Save the script as an indicator to the same view, and it will then be available in your toolbox. Once applied you can change the colour etc in the properties and save as default or add a custom button to your toolbar:
Hi Darren, so grateful for this, thank you. If I wanted to adjust the script above to show a dema crossover, ie 10 dema crosses 30 dema, do I have to name each dema first and then use the crossover function ie DEMA1 CrossesAbove DEMA2. Optuma doesn’t recognise DEMA like it does MA I don’t think. What names can I give to DEMA that Optuma scripting will recognise here. Thank you.
Thank you Darren, that’s exactly what I wanted. I would not have worked out the second part of the calculation you have written, nor the boolean conditions. You’ve been a great help to me.