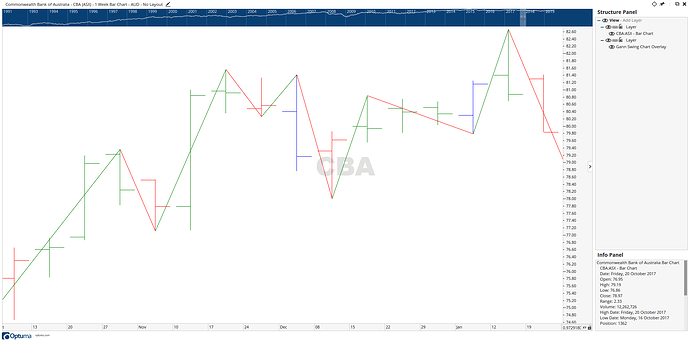
Dow Swing

  1.   I am looking for a script for Dow Swing.  Dow Swing is a technique taught by Dale Gillham of Wealth Within.
    

It is similar to Gann Swing. However in a Gann Swing; outside bars are always considered. In Dow Swing they are treated as part of the trend unless they happen to form the peak or trough?

The GANNSWING() function always includes consideration of Outside bars, even if it is not listed in the parenthesis. There is no DOWSWING function!

2. Also are there any functions that identify Up Bars and Down Bars (i.e. the Green & Red Bars when swing relations is selected on the chart)?


Cheers, Lester

Hi Lester,

You can set the GANNSWING() function to ignore outside bars by changing it to Use Next Bar:

Capture

For up days use CLOSE() IsUp and CLOSE() IsDown for down days.

Hi Darren,

I did try that and it did not work for me. It still seems to recognize the outside bar.

I tried it with the Gann Swing Overlay (GSO). Please see the attached picture. The outside bar with down bars on each side is still considered!

I also tried the it with a Show Plot GANNSWING(SWINGCOUNT=1, USEINSIDE=True, METHOD=Use Next Bar). It produced the same result as the GSO.

Regards, Lester

Hi Lester,

Outside bars can’t be ignored completely - when ‘use next bar’ is selected we have to wait to see what the next bar is doing to determine whether the outside should be treated as a high or a low swing. If the outside bar is used then it will be both a high and low swing.

See Mathew’s video here on swing construction and how inside/outside bars are treated:

https://www.optuma.com/videos/gann-swings-part-1/

Part 2 looks at scripting Gann Swings:

https://www.optuma.com/videos/gann-swings-part-2/

Hi Darren,

Thanks for your answer. Can I request an additional feature to ignore outside bars within a trend move.

Should I make a request on another forum topic?

As I said before it is one of the trading trading methods taught by Dale Gillham of Wealth Within. Dale teaches students to use both Gann Swing and Dow Swing methods (i.e. ignoring the outside bar). Depending on the personality of the share, one can work better than the other. Addition of this feature would save having to back test manually.

Regards, Lester


I am not sure why Optuma havn’t built these directly into Optuma for all WW students who use Optuma.


Would only make sense, I still don’t have a working Dow Swing system in place using Optuma for automatic detection… I graduated nearly 2 years ago…

Hi Darren,

Can you please also help with identifying functions that easily identify Up Bars and Down Bars (i.e. the Green & Red Bars when swing relations is selected on the chart)? There must already be internal coding in Optuma because it can identify them and colour them accordingly.

Such a feature would easily help to script for back testing of Counter Trend entries. Counter trend theory is another method taught by Dale Gillham of Wealth Within.

Regards, Lester

Hi Lester,

The Bartypes() function is what you’re after:

https://help.optuma.com/kb/faq.php?id=992

Ex3

Hi Matthew,

Thank you very much.

Lester

Lester,


When you get a script… please feel free to share with community.

Hi Jonathan,

I could be wrong about this, but I believe Dow Swing searching cannot be done with scripting at present.

There needs to be alteration of the underlying Optuma code to allow the search routine for Out Side bars to be turned off.

I have added my request for such a feature in the “New Feature” forum.

It would add more weight if you also add to my request in the “New Feature” forum.

Cheers, Lester

Yeh,


It was something I tried to solve over a year back.


We need to marsh together to build scripts on all WW content.


Heck, I dont have time to be manually back testing! haha

Hi Johnathan and Forum,

I don’t think this is a solution for scripting a Dow Swing however, it may be of interest to you.

The MetaStock Advanced Formula Writing – Formula Primer II seems to cover identification of peaks and troughs as done by the Optuma scripting functions for Gann Swing.

The document can be found here:

https://www.metastock.com/customer/resources/formulas/Formula_Primer_II.pdf

Chapter 7 covers Pivots. Page 50 headed “Highs & Lows” which seems to describe Dow Swings.

The text works through various algorithms to identify peaks and troughs.

I have made translations from MetaStock Formula Language to Optuma Scripting Language. My formulas complete without error but do not work.

I have tried some in MetaStock and they produce a binary wave which lines up correctly with peaks. I attempted to apply the formulas to the MetaStock Expert without success. I am not well versed with MetaStock as I find Optuma is a way more friendly and capable charting package to use.

Here are my various translations:

Page 51 under heading “Step3: The Final Formula”

HIGH() > VALUEWHEN(HIGHESTHIGH(BARS=40), -1) and HIGH() > VALUEWHEN(HIGH(), +1)


Page 53 under heading “Step3: The Final Formula”

bar1 = VALUEWHEN(high(OFFSET=-2)) > HIGHESTHIGH(BARS=2) and

VALUEWHEN(high(OFFSET=-2)) > VALUEWHEN(HIGHESTHIGH(BARS=2),-3);


bar2 = VALUEWHEN(high(OFFSET=-2)) > HIGHESTHIGH(BARS=2) and

VALUEWHEN(high(OFFSET=-2)) = VALUEWHEN(high(OFFSET=-3)) and

VALUEWHEN(high(OFFSET=-2)) > VALUEWHEN(HIGHESTHIGH(BARS=2), -4);


bar3 = VALUEWHEN(high(OFFSET=-2)) > HIGHESTHIGH(BARS=2) and

VALUEWHEN(high(OFFSET=-2)) = VALUEWHEN(high(OFFSET=-3)) and

VALUEWHEN(high(OFFSET=-2)) = VALUEWHEN(HIGHESTHIGH(BARS=2), -5);


bar2nc = VALUEWHEN(high(OFFSET=-2)) > HIGHESTHIGH(BARS=2) and

VALUEWHEN(high(OFFSET=-2)) = VALUEWHEN(high(OFFSET=-3)) and

VALUEWHEN(high(OFFSET=-2)) = VALUEWHEN(HIGHESTHIGH(BARS=2), -5);


bar3nc = VALUEWHEN(high(OFFSET=-2)) > HIGHESTHIGH(BARS=2) and

VALUEWHEN(high(OFFSET=-2)) = VALUEWHEN(high(OFFSET=-4)) and

VALUEWHEN(high(OFFSET=-2)) = VALUEWHEN(high(OFFSET=-6)) and

VALUEWHEN(high(OFFSET=-2)) = VALUEWHEN(high(OFFSET=-3)) and

VALUEWHEN(high(OFFSET=-2)) = VALUEWHEN(high(OFFSET=-5)) and

VALUEWHEN(high(OFFSET=-2)) = VALUEWHEN(HIGHESTHIGH(BARS=2), -7);


bar1 or ba3 or bar3nc or bar2nc or bar3nc


Page 56 under heading “Step3: The Final Formula”

mu= HIGH() > MAX(high(OFFSET=-1), high(OFFSET=1));

p2 = mu and HIGH() > VALUEWHEN() (2, mu, HIGH());

p3 = mu and HIGH() < VALUEWHEN()(2, mu, HIGH()) and VALUEWHEN(2, mu, p2);

time = LAST(MAX(VALUEWHEN(1, p3, BARCOUNT(p2))));

x = VALUEWHEN(1, p3, ACC(RANGE=Look Back Period, BARS=1) - BARCOUNT(p2));


mju = ACC(RANGE=Look Back Period, BARS=1) == VALUEWHEN(x, time);

pj2 = mju and HIGH() > VALUEWHEN(2, mju, high());

pj3 = mju and HIGH() < VALUEWHEN(2, mju, high()) and VALUEWHEN(2, mju, pj2);

timej = LAST(MAX(VALUEWHEN(1, p3, BARCOUNT(pj2))));

xj = VALUEWHEN(1, pj3, ACC(RANGE=Look Back Period, BARS=1) - BARCOUNT(pj2));


ACC(RANGE=Look Back Period, BARS=1) == VALUEWHEN(x, time) or ACC(RANGE=Look Back Period, BARS=1) == VALUEWHEN(xj, timej)


Cheers, Lester


Hi Forum and any WealthWithin Diploma Students,

I have posted a request for this Dow Swing feature in the New Feature Forum.

If you wish to add support, please do so there.

Regards, Lester


Hi Lester and Forum,

For those who aren’t students of The Wealth Within the Dow theory they teach ignore outside bars. The challenge we face is tracking the low of the a trough, finding a peak, then finding a higher trough and finally triggering the Dow Theory entry.

The below script attempts this.


OutsideBar=(High() > High(OFFSET=1) ) and (Low() < Low(OFFSET=1));
InsideBar=(High() <= High(OFFSET=1) ) and (Low() >= Low(OFFSET=1));
IsDownBar =(High() < High(OFFSET=1) ) and (Low() <= Low(OFFSET=1)); 
IsUpBar =(High() > High(OFFSET=1) ) and (Low() >= Low(OFFSET=1));

#$a = P1[1];
#$b = P2[1];

BarAbovePeak = (HIGH() > HIGHESTHIGH(BARS=$a));
BarBelowTrough = (LOW() < LOWESTLOW(BARS=$b)); 
IsPeak = (HIGH(1) > HIGHESTHIGH(BARS=$a)) and BARTYPES().Lower;
IsTrough = (Low(1) < LOWESTLOW(BARS=$b)) and BARTYPES().Higher;

State = IF (State[1]==0 , 
            // true State 0 Start State Machine
            1, 
            // false State 0
            IF (State[1]==1, 
                // true State 1 Find a Trough
                IF(IsUpBar, 2, 1),
                // false State 1
                IF (State[1]==2, 
                    // true State 2 Find a Peak
                    IF(IsTrough, 1, IF(IsDownBar, 3, 2)),
                    // false State 2
                    IF(State[1]==3,
                        // true State 3 Find a higher Trough
                        IF(BarAbovePeak, 4, IF(BarBelowTrough, 1, 3)),
                        // false State 3
                        IF(State[1]==4, 
                           // True State 4 Send Buy Signal
                           IF(IsUpBar, 2, IF(InsideBar, 2, 1)),  
                           // false State 4
                           1)         
                     )
                  )
            )
        );


IsResetTrough = (State == 1);
IsResetPeak = (State==2 or State == 4);
P2 = IF(IsTrough, 2, IF(IsResetTrough, 1, 1+P2[1]));
P1 = IF(IsPeak, 2, IF(IsResetPeak, 1, 1+P1[1]));

BuySignal = (State == 4);

BuySignal
//State
//P1

While it does get most of the signals, there is an issue it appears with the BARS= being set to the previous troughs or peaks location. It does not accept the variable for bars so it appears to always be looking back 8 bars.

To see an example of the issue

  1. Open a weekly chart of ASX:CBA
  2. Right Click and select the tool "Show Bar"
  3. On the property panel, edit the Condition [Script]
  4. Paste in the above script
  5. Look at bar February 1, 2002
  6. There should be a buy signal
The two commented out variables at the bottom can be used to verify the state machine using a number display, and P1 is the number of bars from the previous peak.

My question is am I not using the BARS= correctly in the HIGHESTHIGH() function or is a limitation of the Vector table (Monad) engine?

Cheers,
Chip

Hi Charles,

Thank you for progressing with this Dow Scan script. Your scripting ability is above my level. I did not know there was a “State” function in Optuma scripting. I did check again at https://help.optuma.com/kb/faq.php?id=714 to see if it had been recently added, but no.

I think it is similar to the “Switch” function used in C++ etc. It would be good to have more information about this “State” function, especially the syntax rules to use it correctly.

I hope others can add to this post.

Cheer, Lester

Hi Lester,

Optuma doesn’t have a state machine function per se, but my first job was developing logic compilers for programmable logic devices and field programmable gate arrays, so I knew anything that allows you to reference the previous state (the previous bar) and has Boolean logic can be turned into a state machine. The state machine above is just a variable that holds the values 0 to 4 which is used in the code that follows to conditionally reset the previous bar counts and trigger the buy signal. After understanding the limitations of the scripting engine and discovering after many application crashes that variables must be referenced in a specific fashion, I finally resorted to mid 80’s style logic design.

DowStateMachine

The above is an image of what I wanted the state machine to do. The IF(<condition>, WhenTrue, WhenFalse) was used to move between the different states.


(next state) = IF((we are in a spicific state), 
    // True if in specific state
    (check to see if we should move to another state or state in the same state),
    // False 
    IF((we are in a different specific state), 
        // True if in the different specific state
        (Check to see if we should move to another state or state in this different specific state),
        // False - Chaing the other responses
        (Chain checks for other specific states)
        )
    );


The code below the state machine can then checks if it is in a specific State and if it is, it triggers an action.


The SWITCH statement in Optuma is an example of a simple state machine with 2 states, The first state is “not in the market” and the trigger to enter the market is the buy signal. It then will keep you “in the market” until a sell signal is detected at which time it returns to the “not in market state”.

Cheers
Chip

Charles (Chip),
I have come across your script (July 1 2020) and it works well enough to save me hours of backtesting. As I am not skilled enough to understand scripts is there a way you could change the one above for a sell signal.

Thanks

Hello Lester and Jonathan,
How are you going with your scripting journey.

Did you manage to get to the bottom of Dow Theory and Gann Swing show plot and buy and sell signals.

Regards
Guru