Hello,
I have been trying to generate a list of strongly trending Stocks from ie Nasdaq 100 or ASX100 that have risen by greater than an average of 20% per year for the last 5 Years, or greater than 100% total over the last 5 years but are thinking there might be a better way to do it.
This criteria may need to be altered, depending on the Index used.
The Script I have been using is as follows -
((CLOSE() - CLOSE()[2530]) / (CLOSE()[2530]) * 100) > 400
I have created this scan in the Scanning Manager, using the current date, selecting Nasdaq 100, Historical, Time Frame = 1 day.
Am I on the right track here or is there a better way to do this?
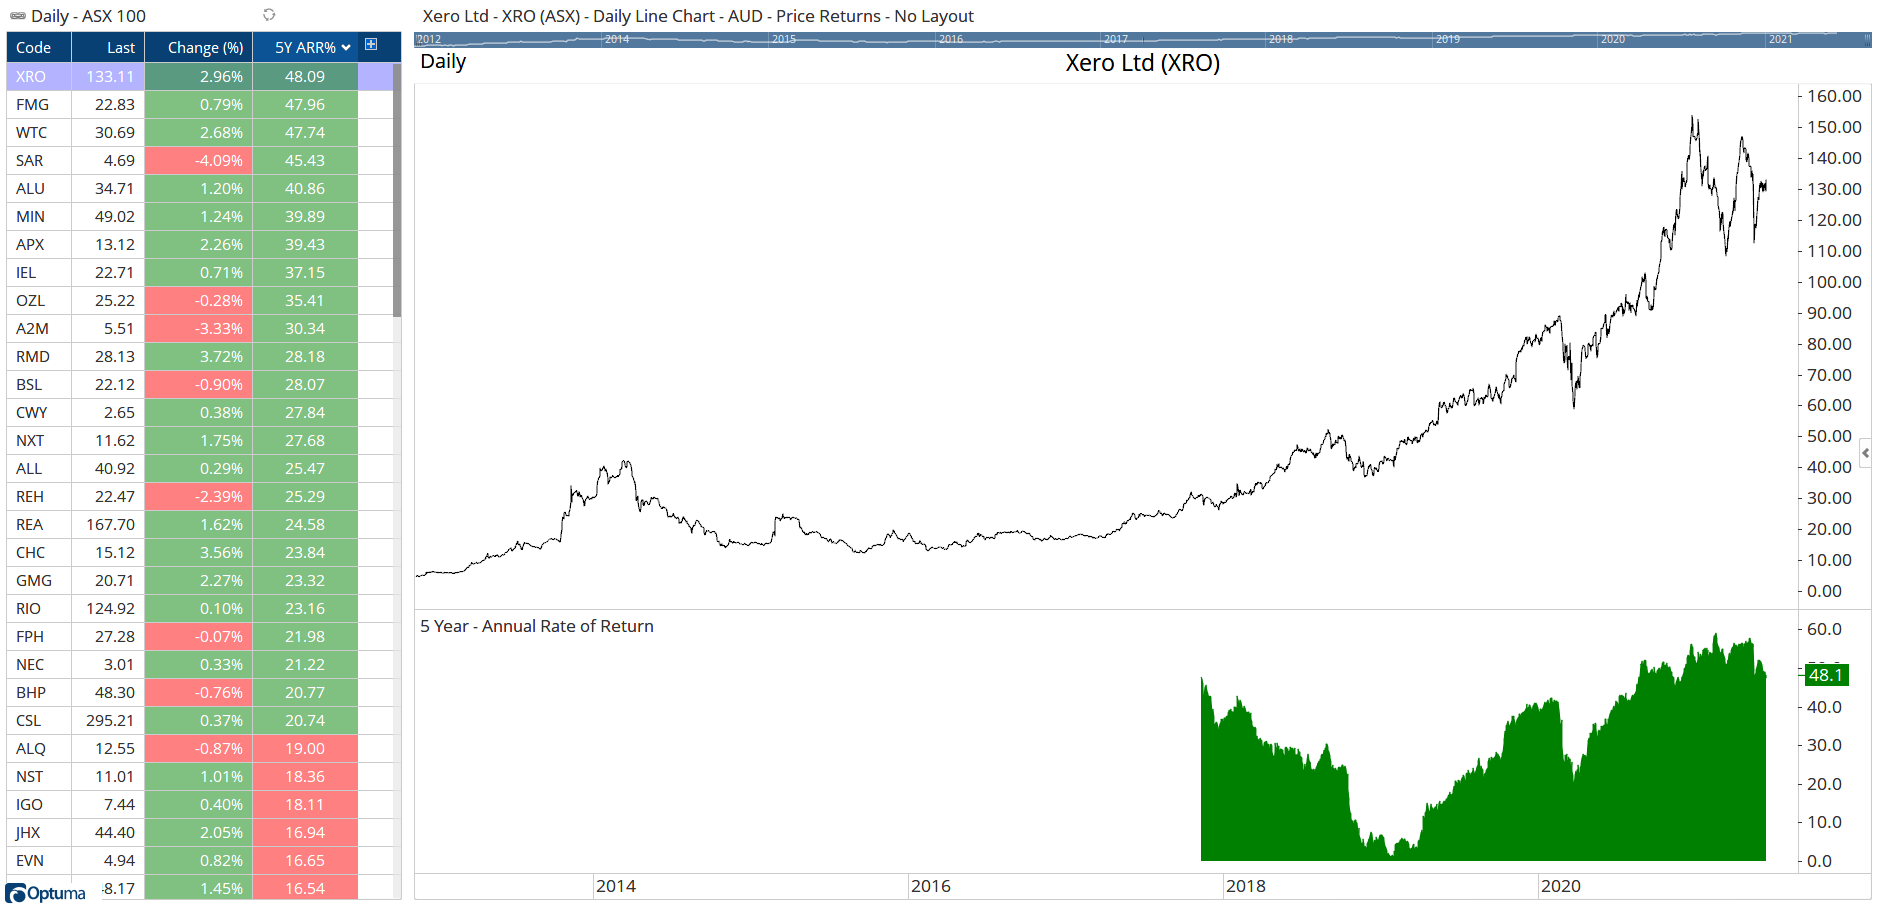
You can use the ARR() function to calculate the Annual Rate of Return. For 5 years use ARR(PERIODAMT=5).
NOTE: because the default watchlist only loads one year of data you will need to change the Date Range in the Properties to 10 years so enough data is available for the calculation to be made.
In this ASX100 list, XRO has gained an average of 48% per year over the last 5 years. Note this doesn’t mean every year has been +20%, only the compounded gain has averaged 20% (if you wanted to look for every year +20% you can use the same concept to calculate quarterly performance described here).
Would it be possible to find say just the 20 strongest percentage gain stocks of an Index ie ASX100 over the last 5 years, using ARR() or another method.
I have no idea how to code this.