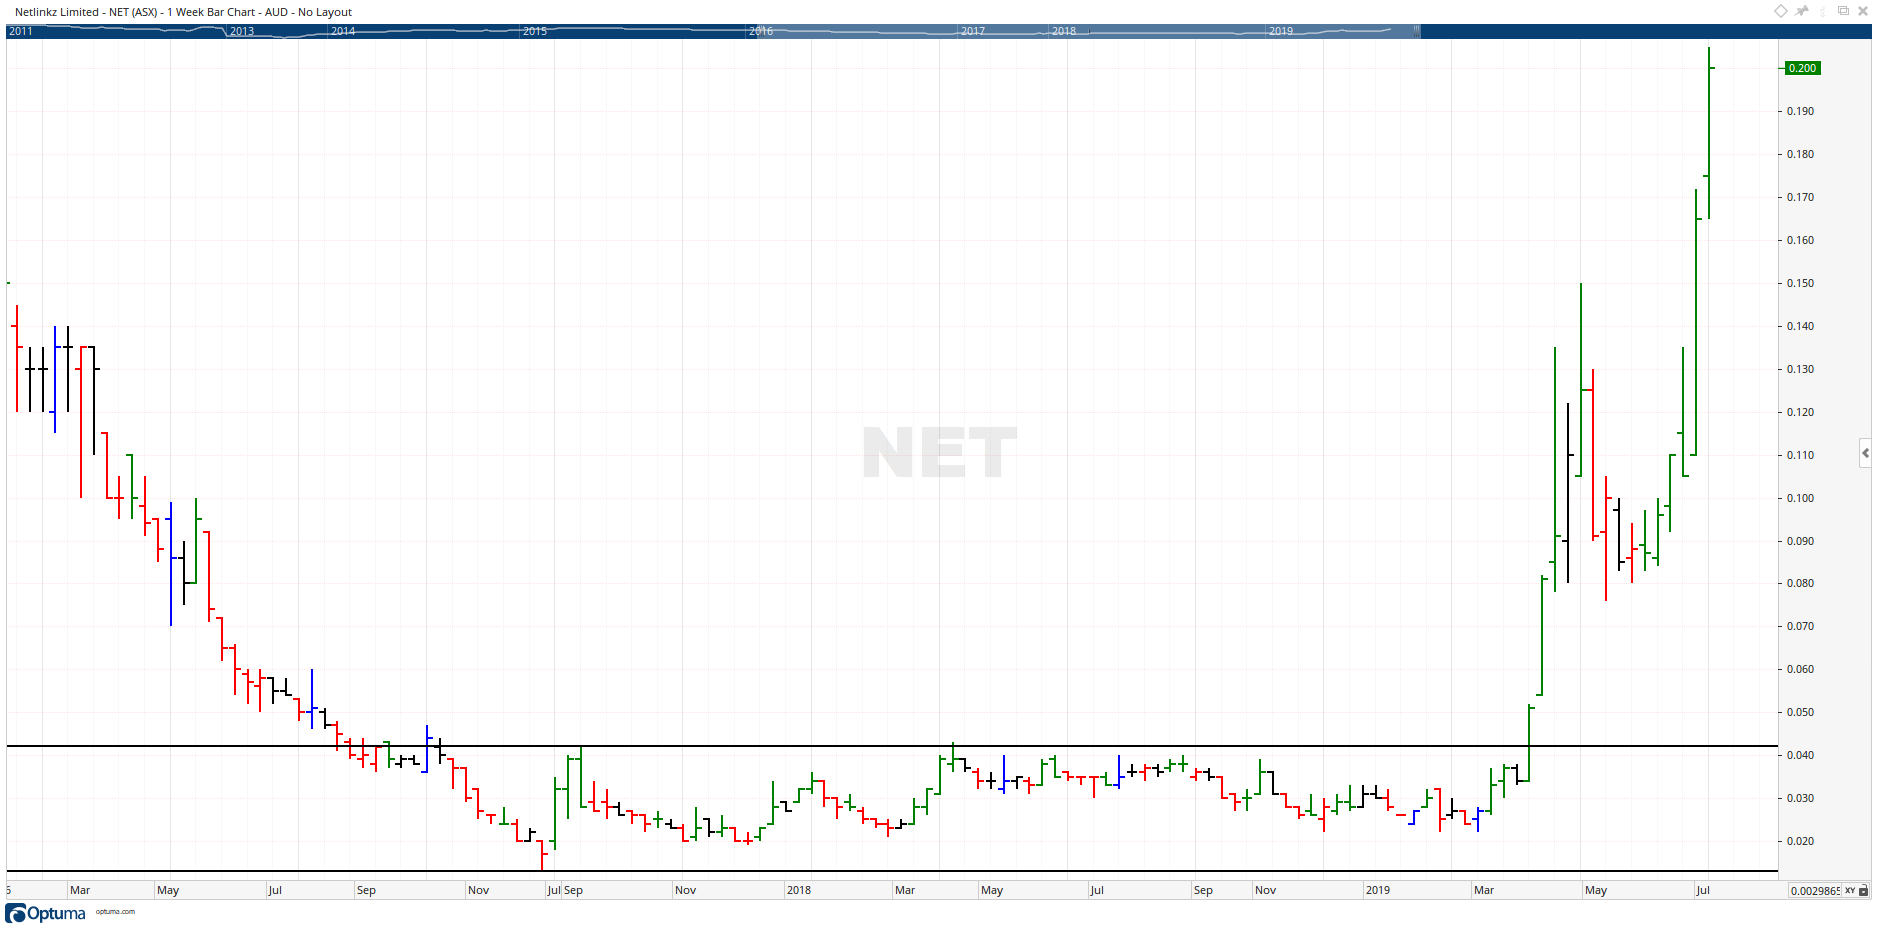
I’ve been contemplating the best way to find these potential breakouts before they occur.
AS anyone on the forum developed a script to find sideways price action over 12-24 weeks as an example? Would be good to get a list of stocks doing nothing.
You can try using something similar to this script to scan for close within 20% (or 10%) of 52 weeks high and then place a limit order where price is higher than previous resistance.
//Close within 20% of 52 Week Highs
CLOSE() >= (HIGHESTHIGH(RANGE=LOOK BACK PERIOD,BARS=260)*0.80)
and CLOSE() > 5;
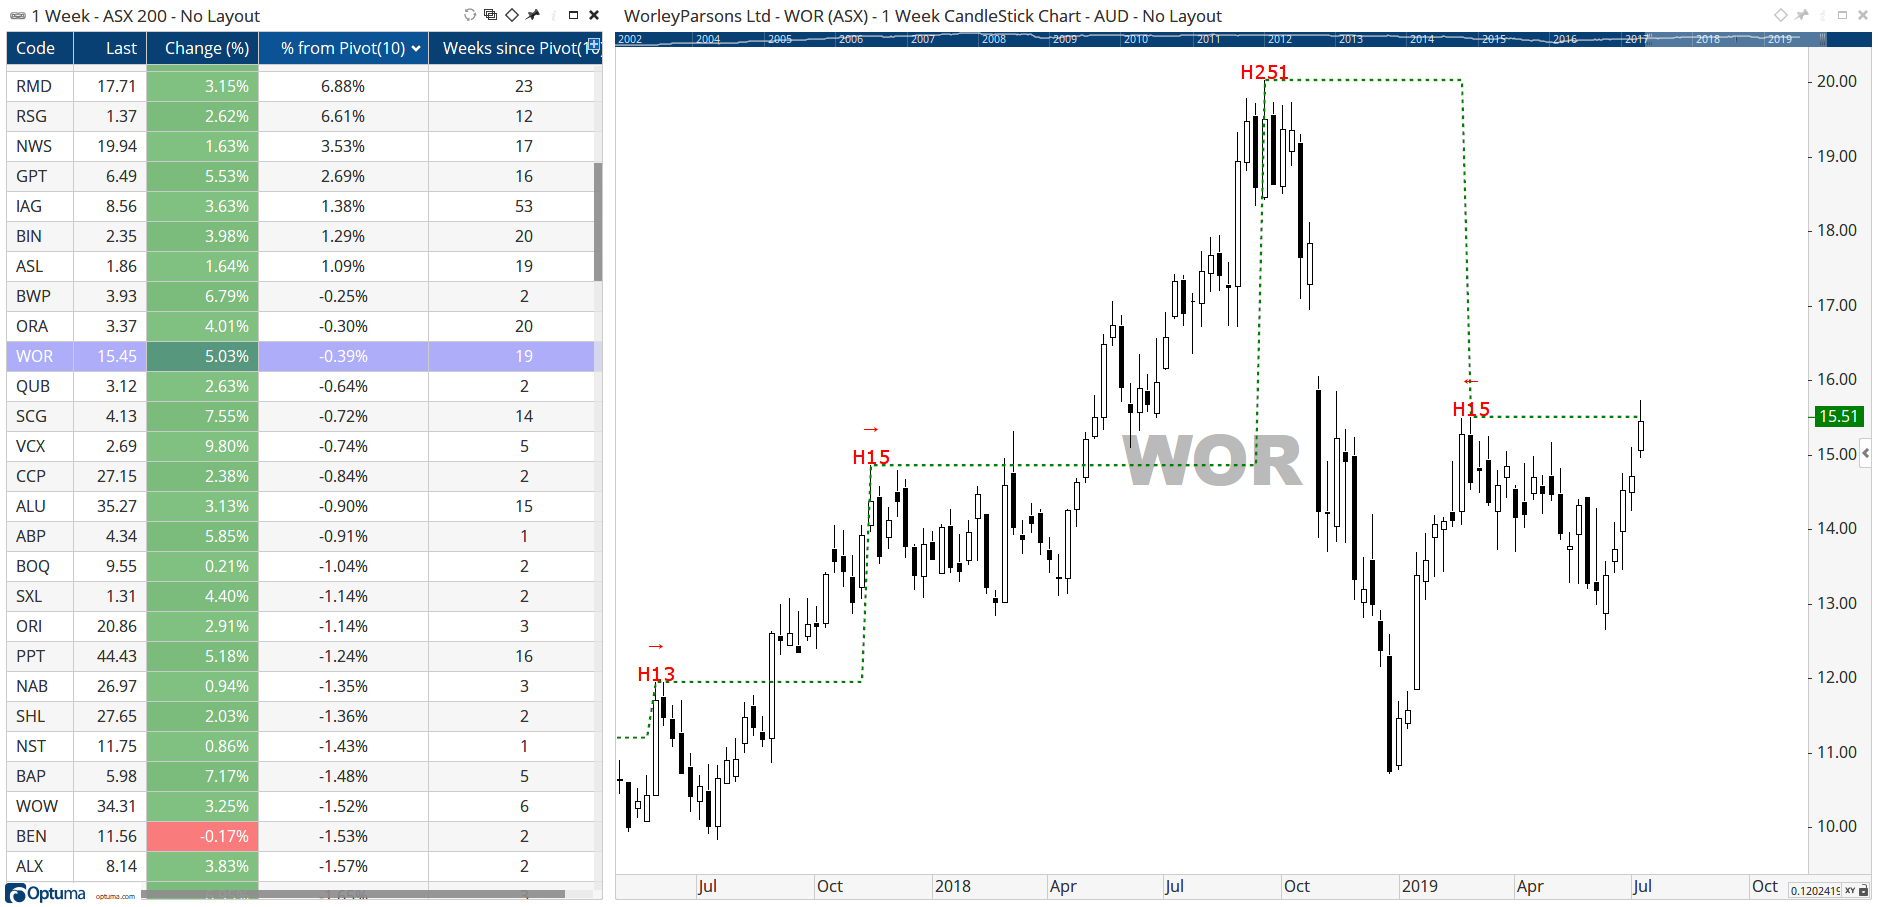
You can also count how long it’s been since the last pivot and how far it is away, eg WOR is 0.39% from it’s last 10 week pivot high that occurred 19 weeks ago: