Hi Darren,
Thank you for your reply, I am aware of Mathews’s explanation. What I wish is conformation of my diagram that I have the correct visual image of how each swing is labeled then processed.
Can you please provide the full formula as I’m not sure what e1 is referring to. Be sure to use the <>Code button above when pasting the formula.
Also, note that the offset to use will depend on the direction of the current swing. For example, if the current swing is up you need to look two swings ago for the prior high as the previous swing end would be the low.
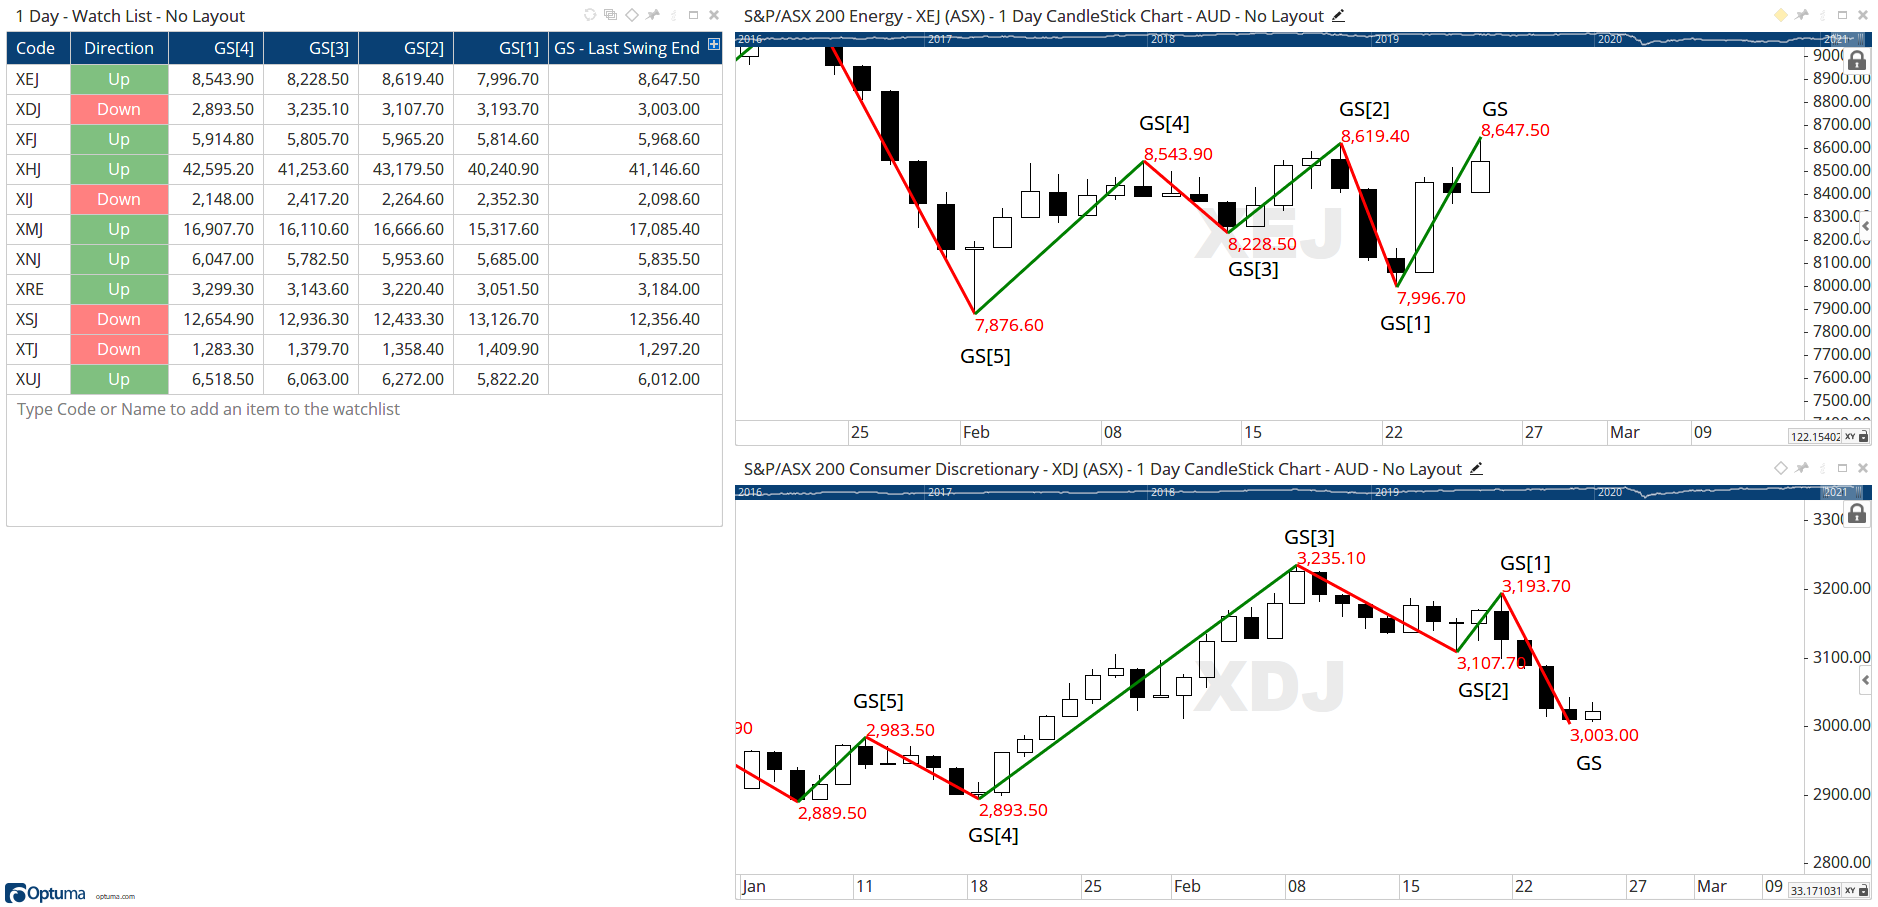
Attached is a workbook with the following watchlist which labels the previous swings. Basically, when the swing is up the previous swing highs are even offsets [2], [4], etc and the lows are odd ie [1], [3]. When the swing is down then the opposite is true.
Is this example of a 2 bar swing (set to use Next Bar and include Inside Bars) XEJ is in an upswing, so the previous swing end GS[1] is the low at 7996, whereas XDJ GS[1] is the high of 3193.
Save and open the workbook to get the formulas for swing end values in this watchlist, eg:
GS1 = GANNSWING(SWINGCOUNT=2, USEINSIDE=True, METHOD=Use Next Bar);
SWINGEND(GS1)[1]
Hi Darren,

Thank you for your reply.  You have answered my main question, which was about correctly labelling of Gann Swing Ends.  Your diagram matches my GS labels.

With regard to the other part of my question the rest of the code is based on Mathews post https://www.optuma.com/videos/gann-swings-part-2/

I had something similar to this.  Note the line //c1 = CLOSE(OFFSET=1) < e1[1] and CLOSE() > e1[1];
//Gann Swing Trend Up U1
g1 = GANNSWING(SWINGCOUNT=1, METHOD=Use Next Bar, USEINSIDE=True);
e1 = SWINGEND(g1);
c1 = CLOSE() CrossesAbove e1[1]; //c1 = CLOSE(OFFSET=1) < e1[1] and CLOSE() > e1[1];
//c1 = CLOSE(OFFSET=1) < e1[1] and CLOSE() > e1[1];
c2 = e1[2] < e1[1];
c3 = (e1[5] > e1[3]) and (e1[3] > e1[1]);
c4 = c1 and c2 and c3;
c4
Cheers, Lester
ps I tried using the "code" format button, but it did not seem to work correctly for me!  Sorry.