I’m trying to write a script that will find the first gann swing high after a major low as determined by a pivot. The pivot low formula is fine. To determine gann swing up I’ve started by using this script from June 17 webinar.
//Gann Swing Trend Up U1
g1 = GANNSWING(SWINGCOUNT=2, METHOD=Use Next Bar, USEINSIDE=True);
e1 = SWINGEND(g1);
c1 = High() CrossesAbove e1[1];
c2 = e1[2] < e1[1]; c3 = (e1[5] > e1[3]) and (e1[3] > e1[1]);
c4 = c1 and c2 and c3;
norepeat(c4)
However when I check these swings using a showbar many of them are invalid. I did my testing on bhp as in the webinar. Can someone advise me how to write a script to find the first swing high after my pivot low.
Thanks Peter
Hi Peter,
Here is a script that will display a SHOWBAR when the Gann Swing (2 Bar) Top is at a Pivot 11 High above after a Gann Swing (2 Bar) Bottom is at a Pivot 11 Low:
// Gann Swing High Above Pivot 11 Low

GS = GANNSWING(SWINGCOUNT=2, METHOD=Use Next Bar, USEINSIDE=True);

PivLo = IF(PIVOT(MIN=11, TYPE=Low, DIR=Backwards) < 0 , 1, 0);
PivHi = IF(PIVOT(MIN=11, TYPE=High, DIR=Backwards) > 0 , 1, 0);

Bottom = If(((SwingStart(GS) OFFSET=1) > (SwingStart(GS) OFFSET=0)) and ((SwingStart(GS) OFFSET=-1) > (SwingStart(GS) OFFSET=0)) , 1, 0);
Top = If(((SwingStart(GS) OFFSET=-1) < (SwingStart(GS) OFFSET=0)) and ((SwingStart(GS) OFFSET=-0) > (SwingStart(GS) OFFSET=-1)) , 1, 0);

Signal1 = IF(PivLo and Bottom, 1, 0);
Signal2 = if(PivHi and Top, 1, 0);

Signal = SIGNALAFTER(Signal1, Signal2, NUMBER=1);
Signal
It produces a chart that looks like this, with the Green SHOWBAR arrows highlighting the Tops after the Bottoms (magenta SHOWBAR arrows):
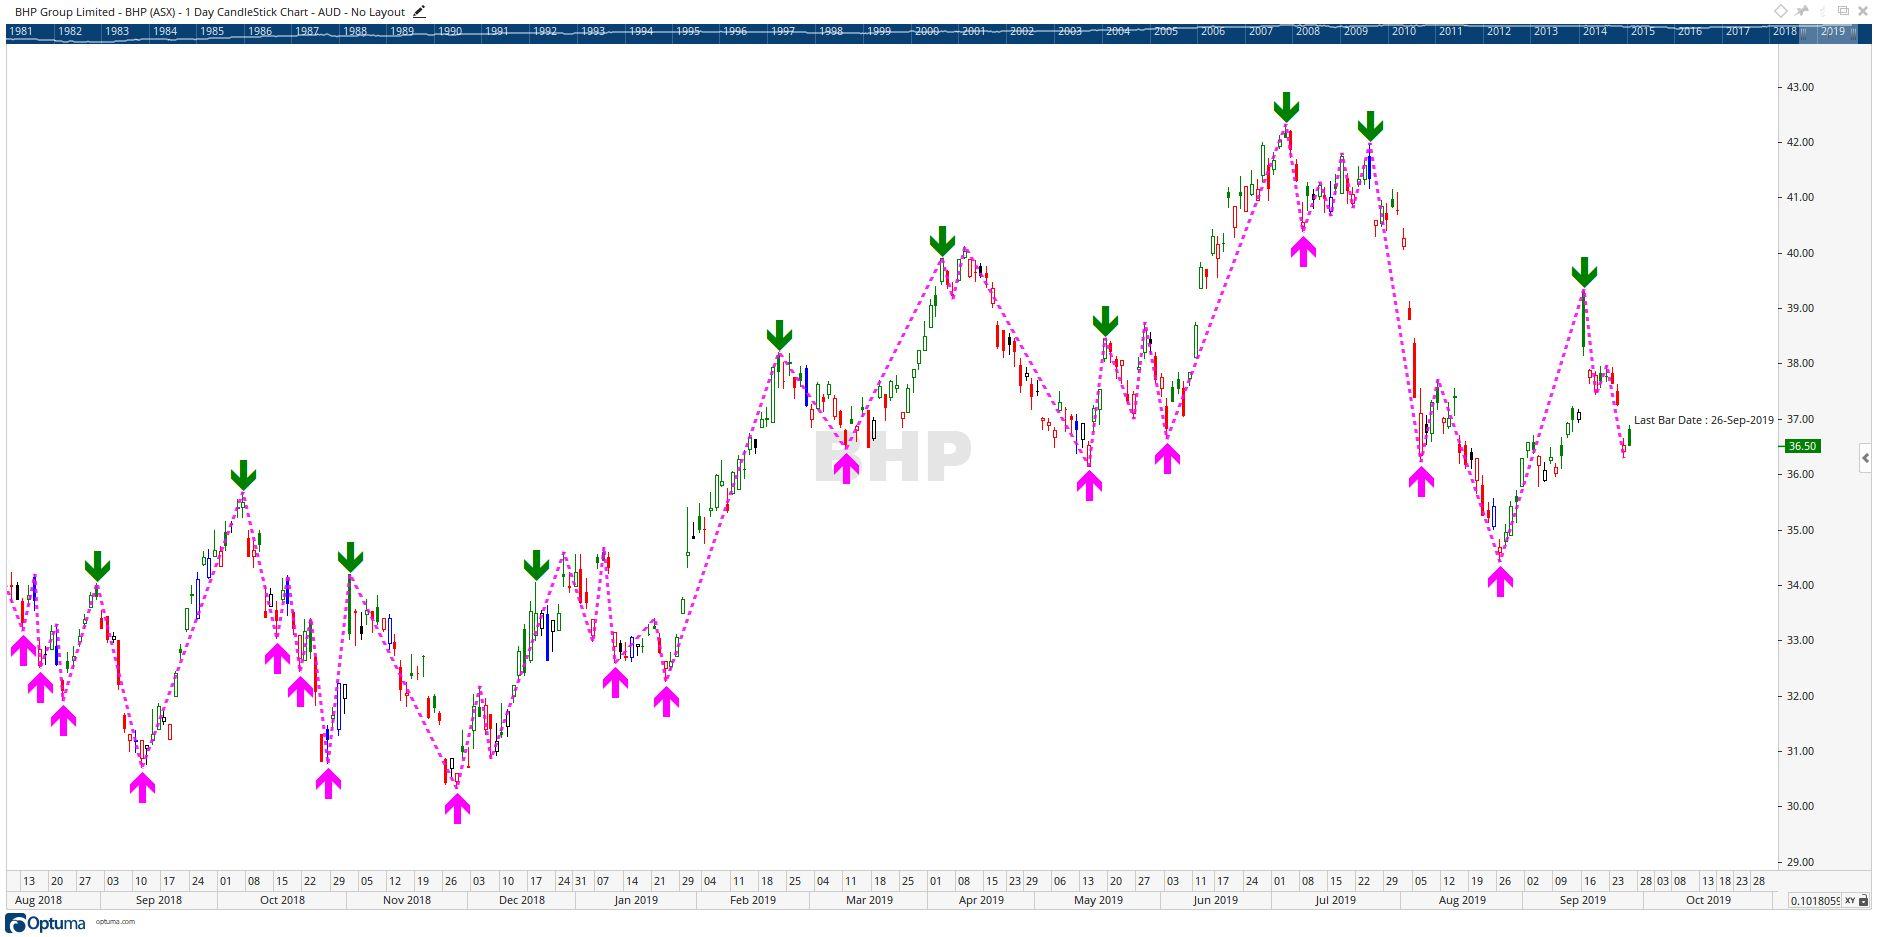
It that what you were after?
Cheers
Trevor
Thanks Trevor. This looks good. I will test further.