I often thought if Optuma had a gap analyzer tool that it would be useful on a chart layout.
For example, open/unfilled gaps could be shown visually with a color-specific horizontal line or shaded region. Vice-versa, closed/filled gaps would have an option to display with separate color.
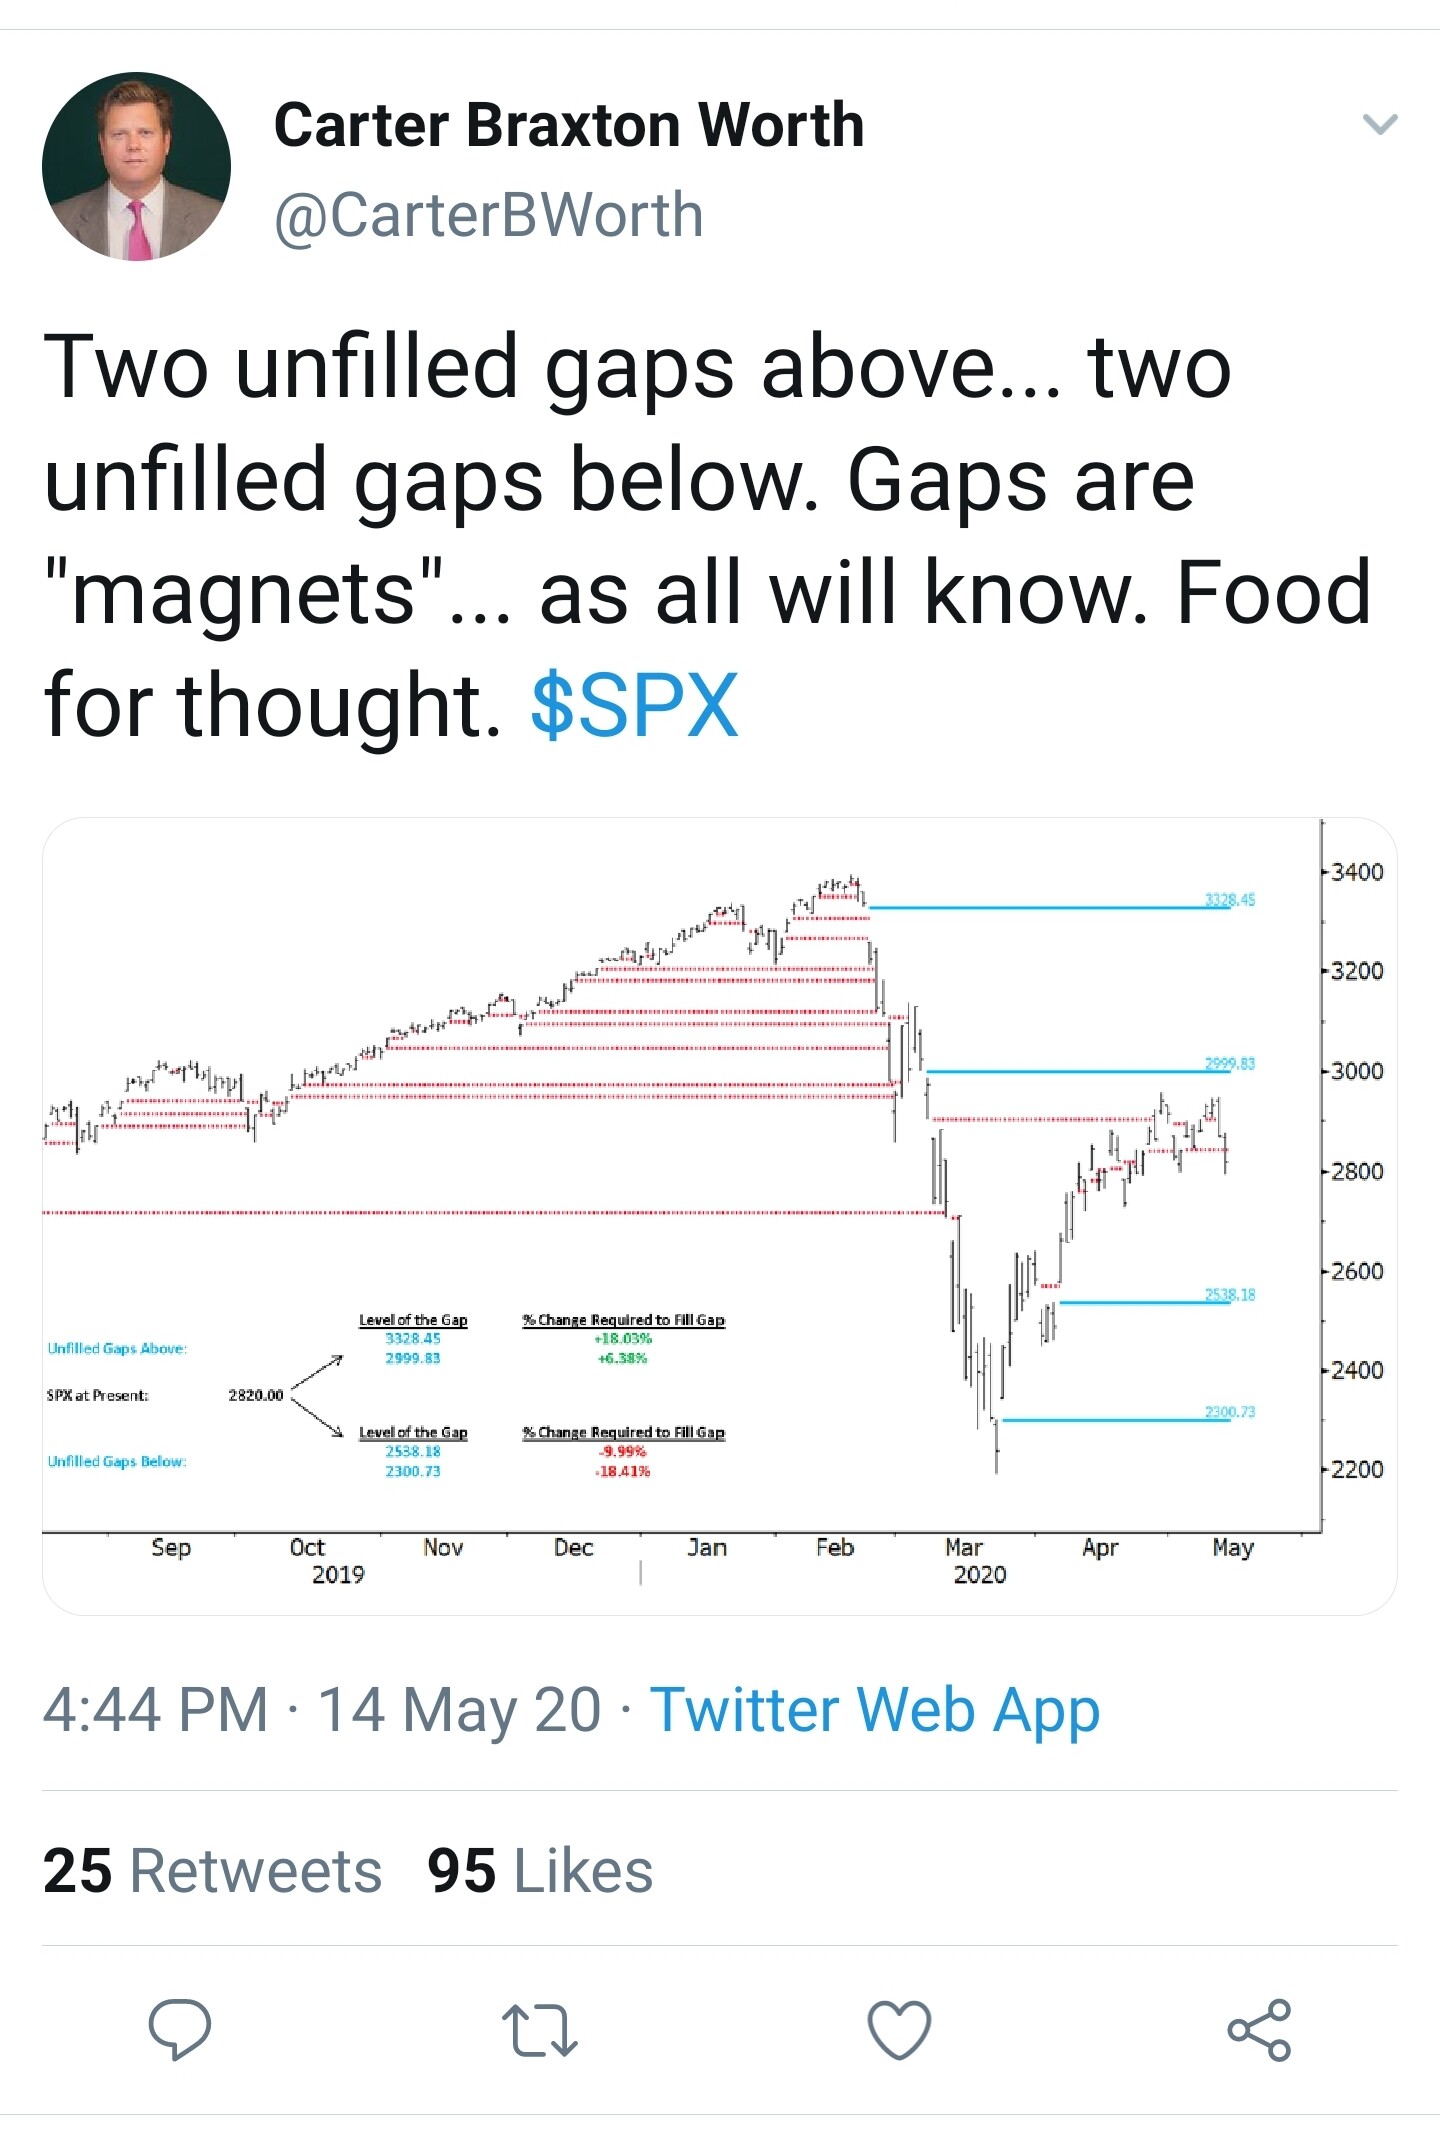
I was reminded of this by a tweet today I saw, see attached.
Additionally, if there were script functions, they would be useful in the signal tester. Example: what are results of a signal if there is an open gap below current price. Etc
I’m trying to find a way to compare one stock to another based solely on past tendency for a stock to have gaps. I have been thinking of a method to be able to add a ‘gap risk’ component into a risk model but I don’t know if there is a way to script something like this. Here is what I have thought of:
A) A variable that adds up all gap space in percentages, up or down ( example: 15% )
B) A variable that adds up all non-gap space in percentages, up or down (example: 1000%)
Then with those data points:
Divide A into B = .015
Lets say this .015 is compared to a competitor’s stock that came up with .035 , then a conclusion could be the first stock has less ‘gap-risk’ and can a factor into a model… The comparisons probably would have to start at the same time, example - last 10 years of data, contingent that both stocks have at least that much history.
Is this possible in scripting? Or maybe there is a better way to think about this with a different method?
I think what you’re after is possible with a script. I’ve included some sample code below and have attached a workbook using the S&P100 constituents to try it on.
//Set Measure Points
V1 = OPEN() ;
V1a = HIGH() ;
V2 = HIGH(1) ;
V2a = LOW(1) ;
//Look for Gaps where Open and Low of current bar is higher than previous bars high
V3 = V1 > V2 and LOW() > V2;
//Look for Gaps where the Open and High of current bar is lower than previous low
V3a = V1 < V2a and V1a < V2a ;
//Find the percentage difference between the Open and Previous High
V4 = 100 * abs(V2 - V1)/V1 ;
//Find the percentage difference between the Open and the Previous Low
V4a = 100 * abs(V2a- V1)/V1 ;
//Find Percent Value for Gap Up and Down
V5 = IF(V3 == 1,V4,0);
V5a = IF(V3a == 1,V4a,0);
//Find Percent Value for non Gap
V6a = V3a == 0 and V3a == 0;
V6 = IF(V6a == 1,V4,0);
//Accumulate All Values
V7 = ACC(V5);
V7a = ACC(V5a) ;
V8 = ACC(V6);
//Add Gap Up and Gap Down Values together and divide by non gap value to build ratio
(V7a + V7a)  / V8
Not sure if it’s 100% what you were wanting to do but should point you in the right direction in building your own script.
I was doing some work on gaps today and was going to post up a question as described by Jeff above ie. is it possible to display a visual horizontal shaded ‘gap’ where a script identifies a gap up/down.
I draw them manually at present and can’t shade between the lines, would be a neat visual feature for gaps to display horizontally and shaded if achievable and not too difficult.