I’ve done some work on a script that looks to work, at least provide you with the building blocks to edit to do exactly what you’re wanting:
//Set Highest High
V1 = HIGHESTHIGH(RANGE=All History);
V2 = HIGH()[3] == V1;
//Set Close Criteria
V3 = CLOSE()[1] < V1 and CLOSE()[2] < V1 and CLOSE()[3] < V1 ;
V4 = V2 and V3;
//Plot High once criteria met
V5 = NONZERO(IF(V4 == 1,V1,0));
V5
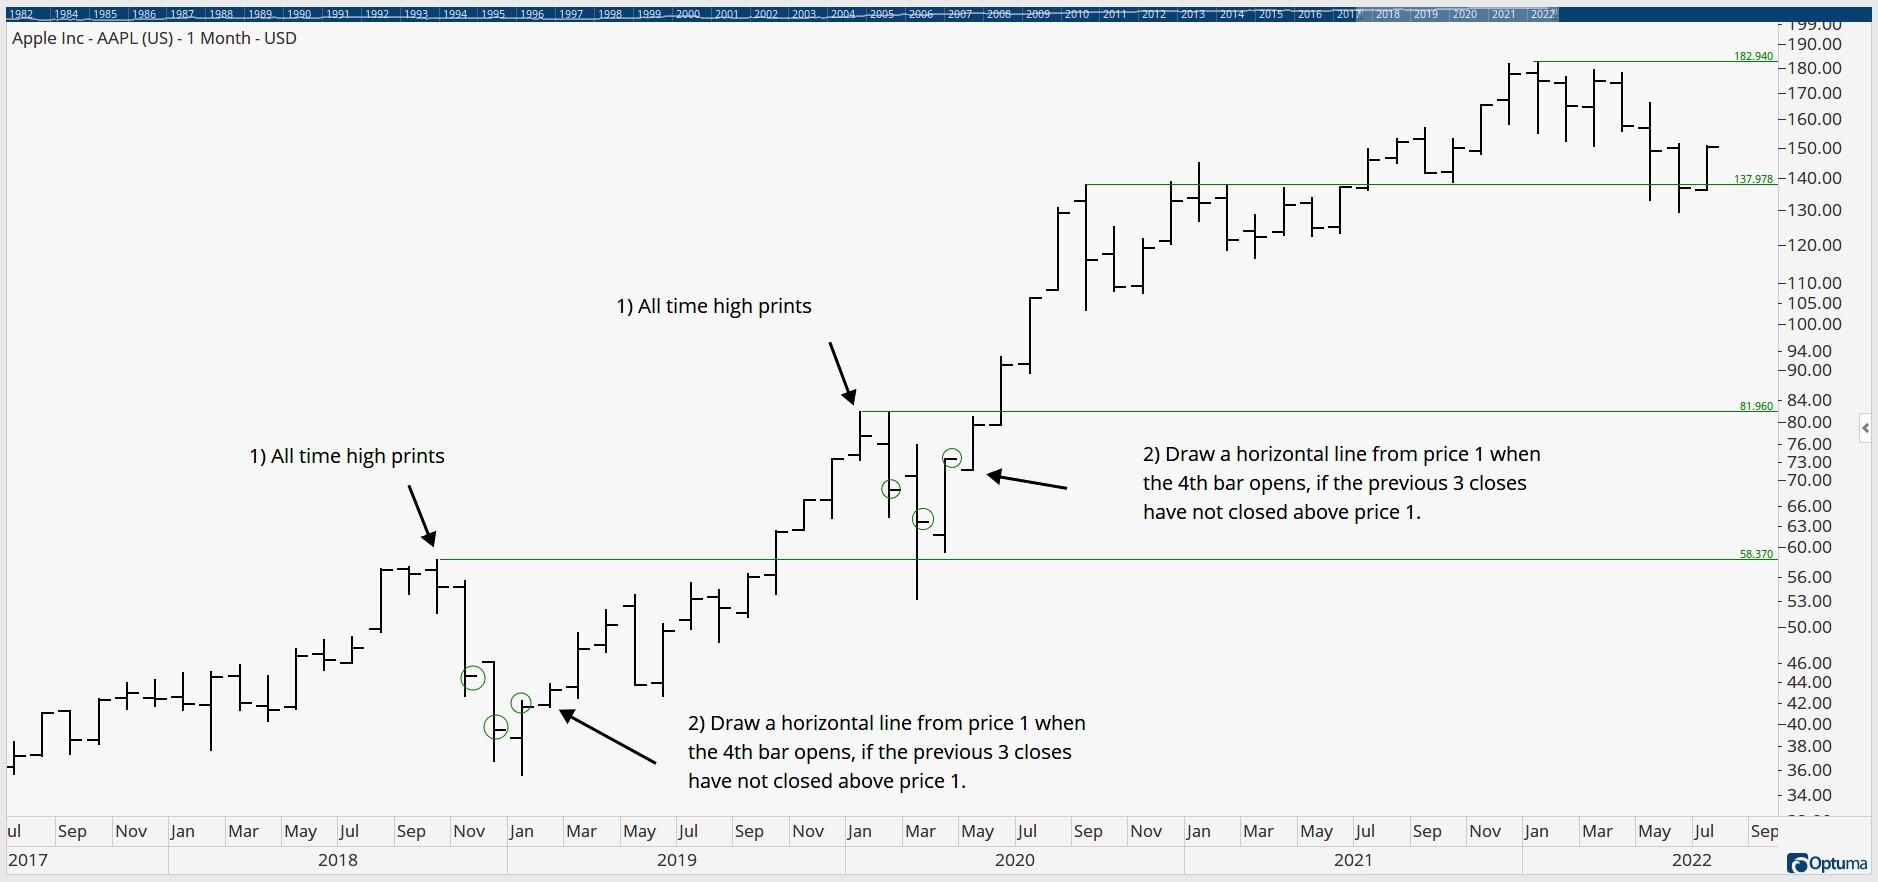
It does not draw the line from the trigger high, it waits for the criteria to occur.
We do not have a function that plots a HL to the end and keeps it there as new values are formed, it’s a single line that moves as a new value is triggered.