help with gann swing pattern solution please

In the following link, https://www.optuma.com/videos/gann-swings-part-2/ was a talk by Mathew VERDOUW in relation to gann swing testing, however due to technical issues with the swingend function, it can’t be used reliably for the purpose of testing gann swing patterns. So in trying to find a solution with What is available out there and myself are formulae’s for finding the pattern but before its complete. So the pattern in the video has 3 lower swing tops and generates a buy when it crosses the lowest swing high.

However it can not reference the immediate swing low before crossing above the swing high so it finds all such occurrences whether it happens after a higher swing low, or a lower swing low. So the closest solution is using gannswings in the formulae but the closest I can get to the pattern is that it finds the pattern the moment the 3 lower tops occur and then after that the swing turns up. So in my formulae (1) which is below, it only finds the occurences when their is a higher swing bottom.

Problem is of course is that the swing up when generated may not also cross above the swing high, before turning down. Because it does not cross the previous swing high during that same upswing it means the pattern did not actually eventuate.

So I have another formulae that indicates when a swing high is crossed after the forming of a new swing low(irrespective of whether it was higher swing low bottom or a lower swing low bottom) Now of course I can set up watchlists and scanners to find either condition but what I want, is to be able to use the BACKTESTER for testing gann swing patterns.

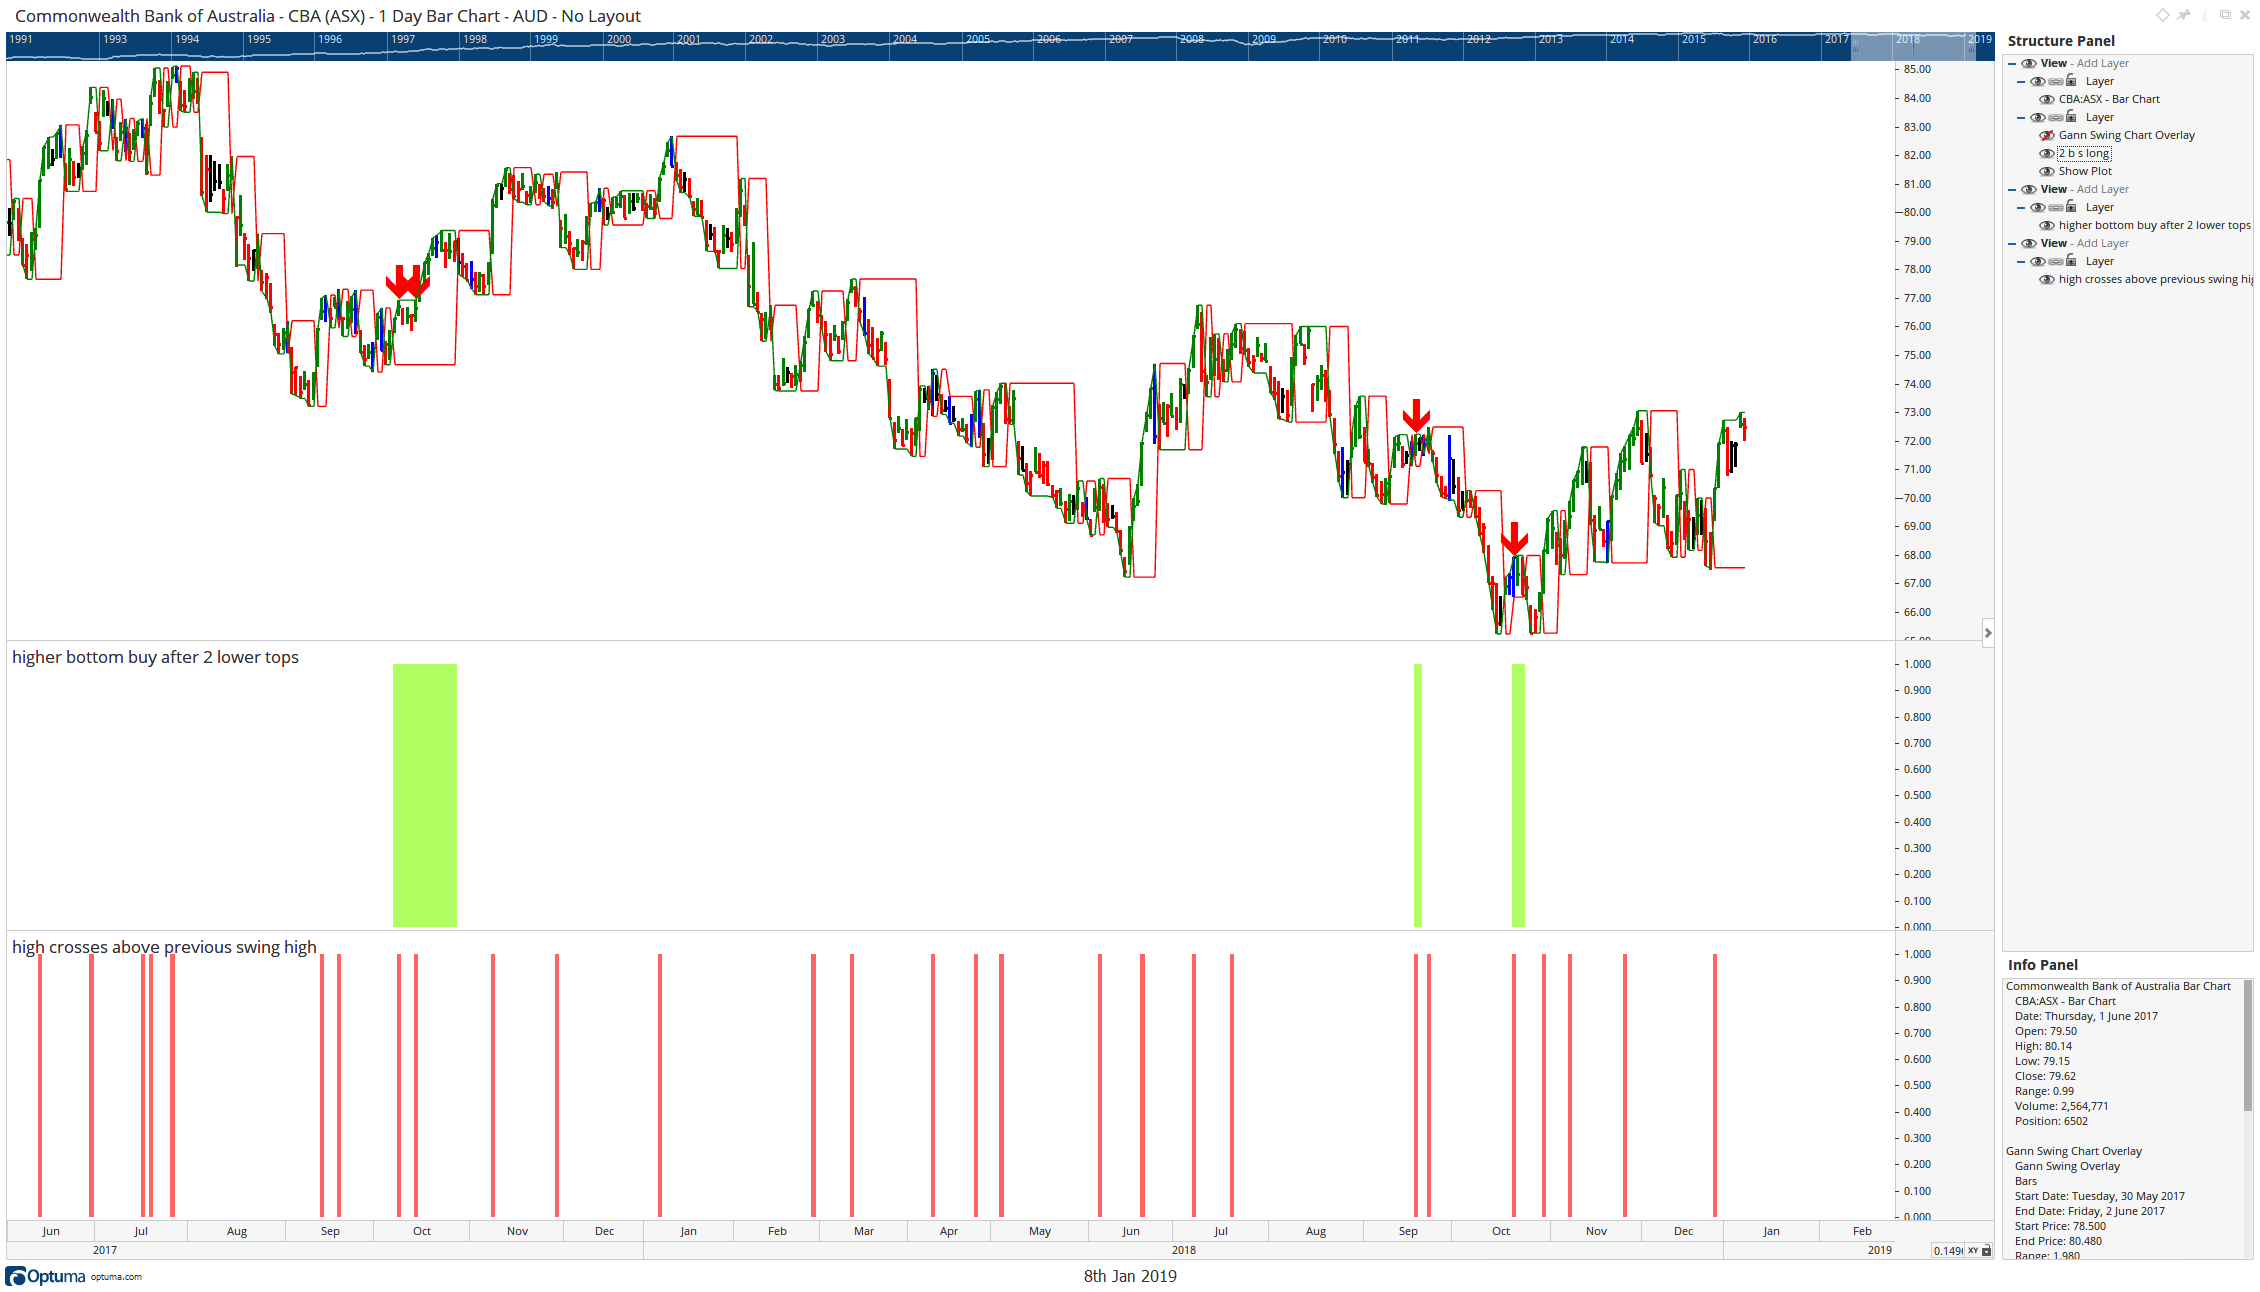
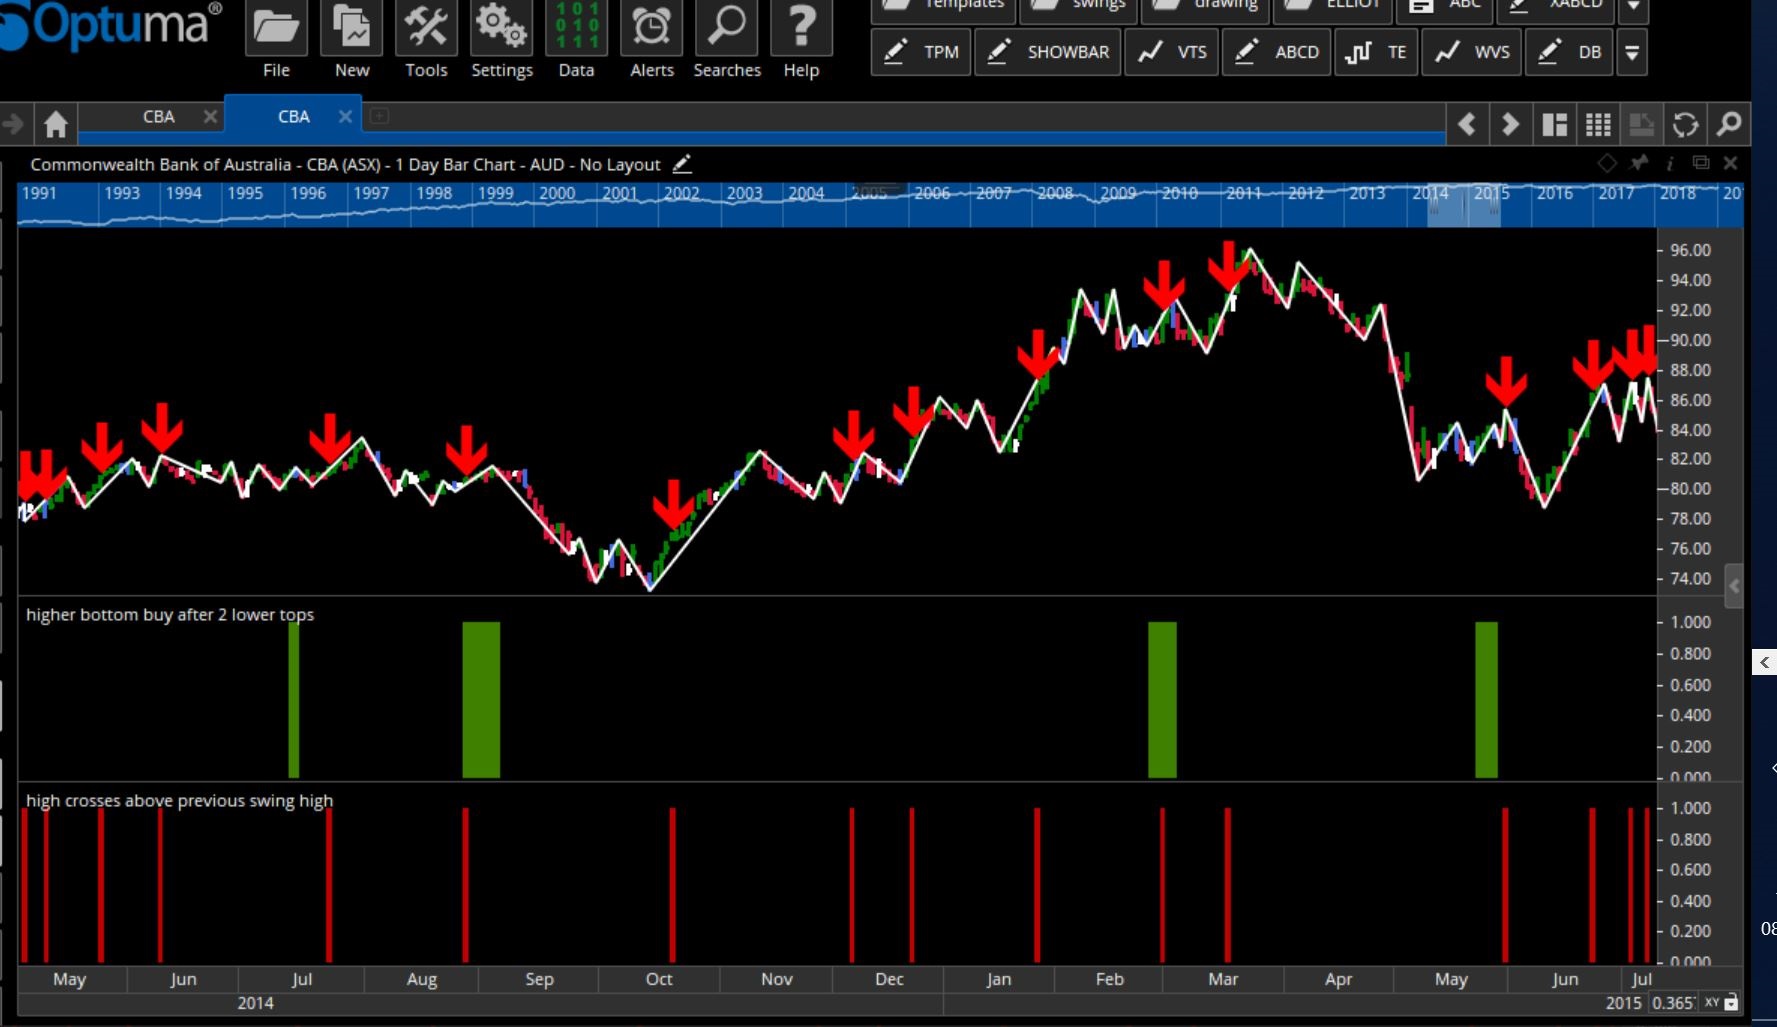
So in the attached picture and workbook the GREEN ‘higher bottom buy after 2 lower tops’ lines finds the potential pattern at the point of the swing turning up off a higher swing bottom.

The RED lines ‘high crosses above previous swing high’ find the basic pattern of a swing higher being crossed.

Now in reality what I would want to be able to do is identify when the green bar formulae occurs and then when the red bar formulae occurs during the same upswing, then and only then would the pattern be complete and usable for the purpose of testing.

So in the end is their a way to combine the 2 formulae in some way so that I can use it in the backtester so it only finds the completed patterns for the purpose of entry. I have had no luck myself hence the forum request.

In the attached picture it is a daily chart of commonwealth bank(CBA) on the Australian market. Overlaid is a 2 bar gann swing using outside bar and inside bar options. The red arrows are the same formulae as the bottom red bars, I though it would make it easier to see. So looking at the picture the completed pattern would only occur when the bottom new tool green bar and bottom new tool red bar align with each other. Below are the 2 formulae as well. I have also attached a workbook if that helps.

formulae 1 - higher bottom buy after 2 lower tops

GS1 = GANNSWING(SWINGCOUNT=2, USEINSIDE=True, METHOD=Use Outside Bar, USECLUSTERS=False); SWINGUP(GS1) and (SWINGSTART(GS1) < SWINGSTART(GS1, 1))and (SWINGSTART(GS1, 1) < SWINGSTART(GS1, 3)) and SWINGSTART(gs1) > SWINGSTART(gs1, 2) and (SWINGSTART(GS1, 3) < SWINGSTART(GS1, 5)) and SWINGSTART(gs1,2) < SWINGSTART(gs1, 4)


Formulae 2 High crosses above previous swing high

g1 = GANNSWING(SWINGCOUNT=2, USECLUSTERS=False, USEINSIDE=True, METHOD=Use Outside Bar) ;

s1 = SWINGEND(g1[1]);

U1 = SWINGUP(g1);

V1 = IF(S1 < SWINGEND(g1[2]),SWINGEND(g1[2]),S1) ;

high() CrossesAbove V1 and U1 == 1

cba-gann-swing.owb (19.3 KB)

Hi Tim,

You are coming across one of the most difficult issues with any Swing Chart scripting and that is the mixing of swing conditions with bar-by-bar conditions. For the sake of others reading this, I’ll elaborate.

Ok, grab a coffee - or stimulant of choice - as this is going to go deep.

On the bar chart we see zones where the swing script is true. But that is often a drawing item that has been joined so it looks nice. The scripting engine is not seeing a value for each date in the zone.

Internally normal Bar Chart data looks like this:

bar

When you look at the dates you can see that the data is sequential - and easy to work with.

Now with swings, we do not have a value for each day. It looks like this:

When you look at the dates here, you will see that we can get multiple swings on the one date (outside bars) and can also go days without getting a swing. It is these gaps that are a nightmare to work with (not to mention the multiple swings on one day).

On a chart the drawing engine handles that and stretches everything so we get nice zones. But in the scripting engine we don’t have the same luxury. The reason is that there may be a reason that we want to work with Swing Lists instead of Bar Lists. We need to have the flexibility to be able to do both.

So when I do SwingEnd(G1) my result is a Swing List with all the date gaps. But when I do G1.SwingEnd, I have a bar list as that function returns the position of the swing for each day. It calculates where the swing would have been on that day. ie on the third day of a 10 day up swing, it will calculate where the swing high was on that day. The point is that we should not report the end of the swing on day 3 when the end has not happened yet.

In system testing this was a huge issue as we were reporting the end of the swing and the results said it was time to retire and live on an island somewhere.

So to clarify your comment that “due to technical issues with the swingend function, it can’t be used reliably for the purpose of testing gann swing patterns” it is because of the above that it is better to use SwingStart for searching for patterns, not because of any errors.

Now to the script!

The issue with script 1 is that its result is a Swing List. In Script 2 you have a bar list and you are trying to compare them. The simple hack to convert a swing list to a bar list is to add a bar list condition to the script.

Just as a matter of readability, try to avoid the big clustered “and” statements. It makes it really hard to read. Instead, do this:

GS1 = GANNSWING(SWINGCOUNT=2, USEINSIDE=True, METHOD=Use Outside Bar, USECLUSTERS=False);

c1 = SWINGUP(GS1);
c2 = SWINGSTART(GS1) < SWINGSTART(GS1, 1);
c3 = SWINGSTART(GS1, 1) < SWINGSTART(GS1, 3);
c4 = SWINGSTART(GS1) > SWINGSTART(GS1, 2);
c5 = SWINGSTART(GS1, 3) < SWINGSTART(GS1, 5);
c6 = SWINGSTART(GS1, 2) < SWINGSTART(GS1, 4);

c7 = Close() > 0;

c1 and c2 and c3 and c4 and c5 and c6 and c7

As soon as Optuma sees the c7 condition, the script engine will convert the script list to a bar list. It wont look different on the chart but you will see the results.

NOTE: Regarding offsets, SWINGSTART(GS1, 1) is the same as SWINGSTART(GS1)[1]. Both will calculate the previous swing’s starting value.

If you had combined the two scripts into 1, you would have had the same result as you were using “High()” in script 2.

Here is my version of that:

GS1 = GANNSWING(SWINGCOUNT=2, USEINSIDE=True, METHOD=Use Outside Bar, USECLUSTERS=False);

c1 = SWINGUP(GS1);
c2 = SWINGSTART(GS1) < SWINGSTART(GS1, 1);
c3 = SWINGSTART(GS1, 1) < SWINGSTART(GS1, 3);
c4 = SWINGSTART(GS1) > SWINGSTART(GS1, 2);
c5 = SWINGSTART(GS1, 3) < SWINGSTART(GS1, 5);
c6 = SWINGSTART(GS1, 2) < SWINGSTART(GS1, 4);

s1 = SWINGEND(GS1[1]);
U1 = SWINGUP(GS1);
V1 = IF(S1 < SWINGEND(GS1[2]),SWINGEND(GS1[2]),S1) ;

c7 = high() CrossesAbove V1 and U1 == 1;

c1 and c2 and c3 and c4 and c5 and c6 and c7

And here are the results of that. You can see the Red Arrows on the chart where this script is true.

It may be best to put all the c’s into another variable and then do a NoRepeat() to get rid of that second signal in a row.

c8 = c1 and c2 and c3 and c4 and c5 and c6 and c7;
NOREPEAT(c8, BARS=10)


Also note on this chart I have this script as a ShowPlot - I needed to see the results to get it clear in my head.

GS1 = GANNSWING(SWINGCOUNT=2, USEINSIDE=True, METHOD=Use Outside Bar, USECLUSTERS=False);

plot1 = gs1.swingstart;
plot1.Colour = Red;

plot2 = gs1.SwingEnd;
plot2.Colour = Green;

You can see how the green line “grows” with the swing end.

So in summary:

SwingStart(GS1) and SwingEnd(GS1) return SwingLists.

GS1.SwingStart and GS1.SwingEnd return BarLists (or a value for each day)

Both have their uses. eg GS1.SwingEnd[1] will not give me the end of the last swing, but SwingEnd(GS1)[1] will.
On the flipside, GS1.SwingEnd[1] will tell you where the swing end was yesterday.

I do feel that it would have made more sense if the two operations were flipped, but with so many people using scripts we can not make that change without blowing up a lot of people’s work. So we are stuck with it working this way.

I’ve attached my version of the workbook here for you.

Hope that helps

Mathew.

cba-gann-swing1.owb (24.6 KB)

Thanks Mathew, your a gentleman and also a scholar

We'd welcome you too :-)

Thank you Mathew for the clarification of the post video review and an updated swing scripts.
And yes, that was a deep explanation.
End result now, I’ve now got my show plots working as I wanted. <woo hoo!>
I know at this stage I was not good enough to do it and appreciate you sharing your knowledge.

Barry.

[postquote quote=65347]
share them :wink: