Hi,
Is there a way to get the High and Low of specific Bar(s) on the 30min Chart (eg: High and Low of the 16:30 and/or 17:00 Bar)?
Thanks
Regards
Junyi
Hi,
Is there a way to get the High and Low of specific Bar(s) on the 30min Chart (eg: High and Low of the 16:30 and/or 17:00 Bar)?
Thanks
Regards
Junyi
Hi,
It can be done but it can be a little tricky. I’ve discussed referencing intraday bar dates in previous posts, which can be modified for the purposes you’re after.
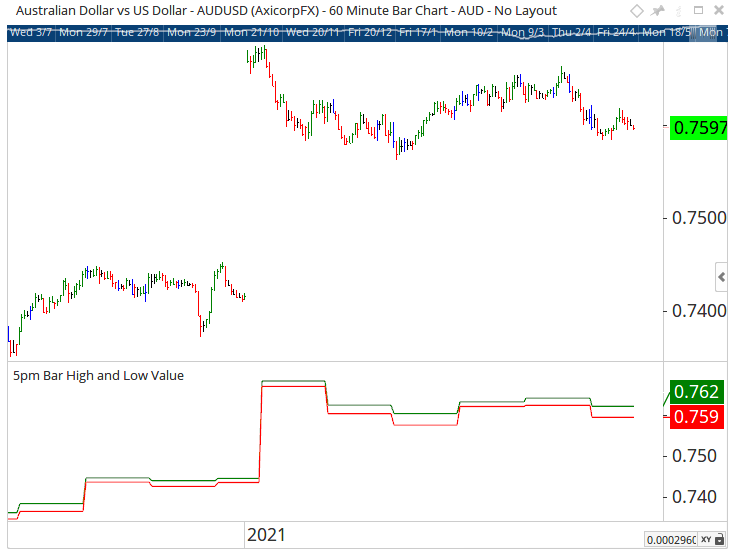
Below is an example of displaying the High and Low price for the 5pm bar each day:
//Set Intraday Bar Index
V1 = BARDATE();
V2 = ROUND(V1, DECIMALTYPE=0) ;
V3 = V2 - V1;
//Look for the 5pm Bar
V4 = V3 > 0.29160 and V3 < 0.29170;
//When 5pm Bar is Found find High Price
V5 = IF(V4 == 1, HIGH(),0);
V6 = NONZERO(V5);
//When 5pm Bar is Found find Low Price
V7 = IF(V4 == 1, LOW(),0);
V8 = NONZERO(V7) ;
//Plot Results
plot1 = V6;
plot2 = V8;
plot2.Colour = Red;
The result looks like the following:
Green Line = 5pm High Price and Red Line = 5pm Low Price
I’ve attached a copy of the workbook I used (uses Axicorp data).
IntradyBarMarker.owb (12.9 KB)