The criteria for the first two rules for the top are as follows (the bottoms are the opposite). The values in the square brackets are the offsets, so [1] is the previous bar, and [2] is 2 bars ago.
1. CLOSE() < LOW()[1]
2. CLOSE()[1] > HIGH()[2]
How would you mathematically define the run up for the 3rd point?
An interesting approach to analysing Reversal Patterns.
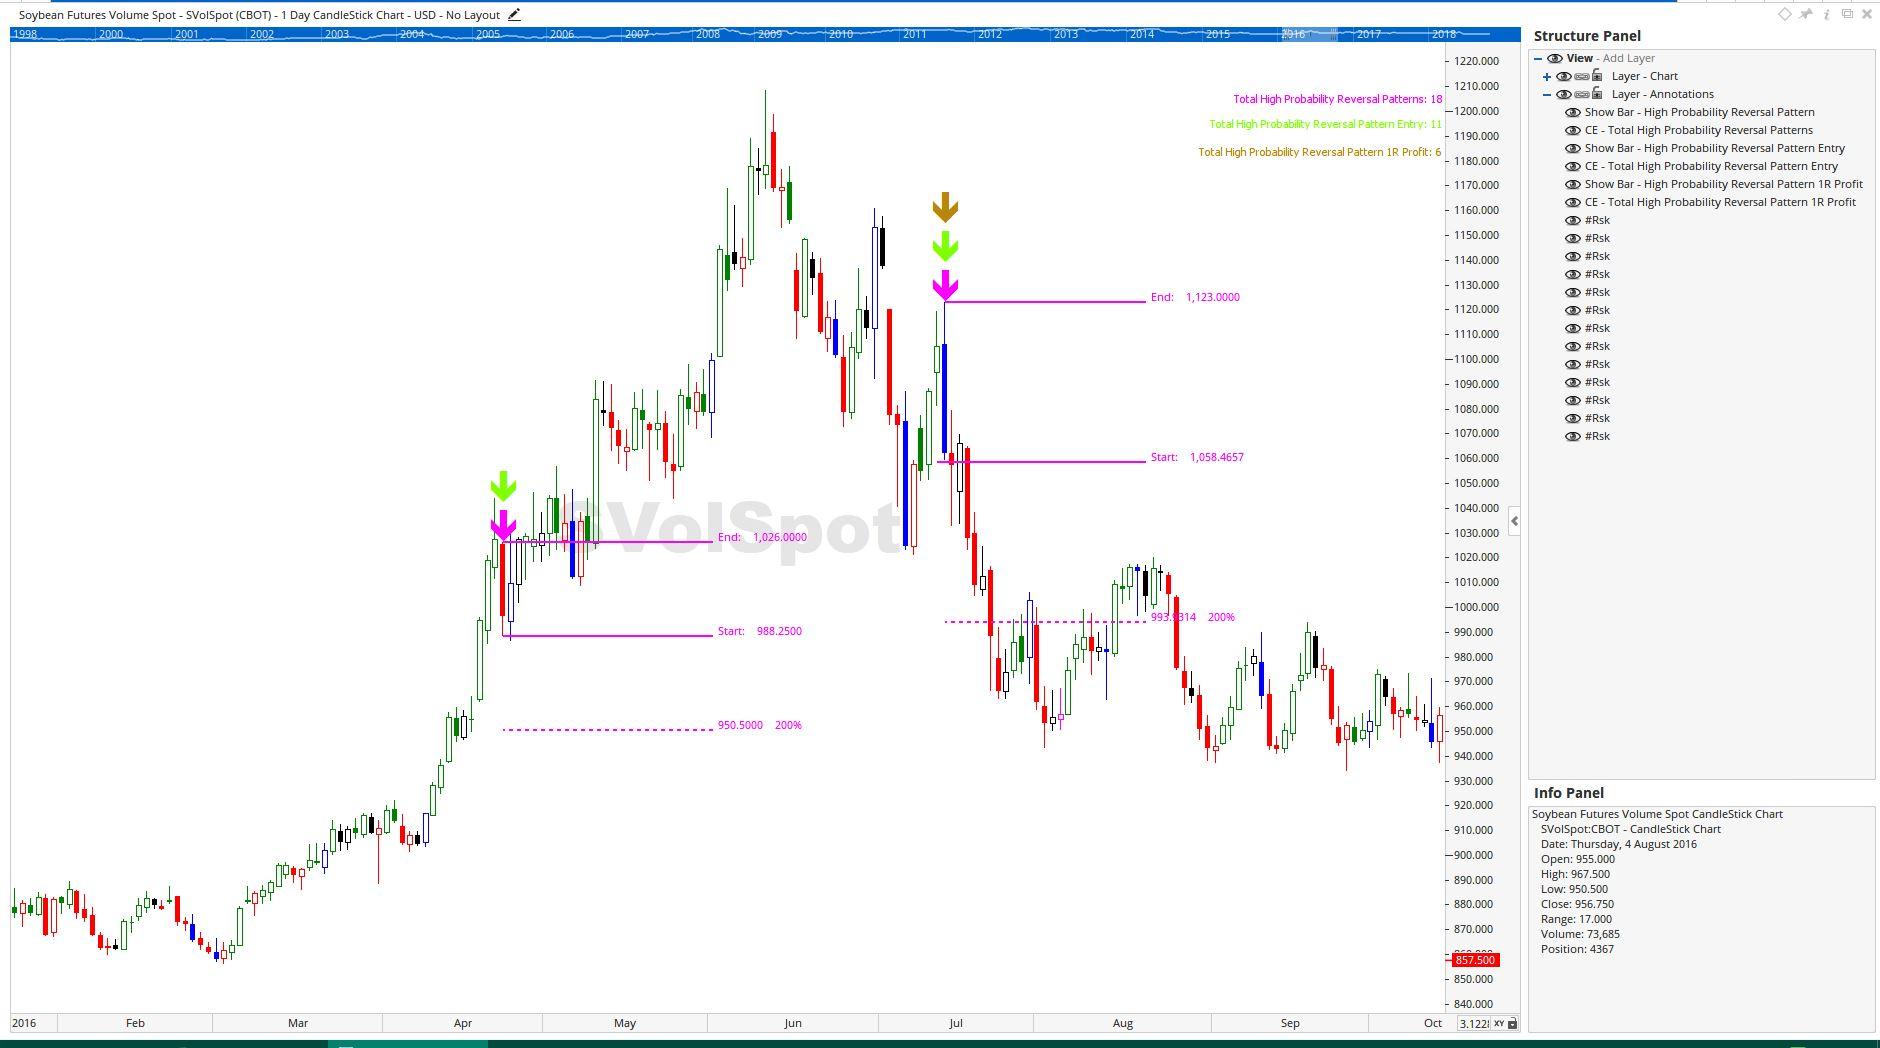
In the attached workbook I've used the following script for finding the desired patterns:
// High Probability Reversal Pattern
v1= CLOSE() < LOW()[1];
v2 = CLOSE()[1] > HIGH()[2];
v3 = ROC(BARS=5) > 3;
If(v1 and v2 and v3,1,0)
I toyed with the ROC function and found using ROC with fewer that 5 Bars and a value of less than 3 gave too many erroneous results. However, changing those parameters may give you more of what you are looking for.
I've also created scripts to count Entries and the "profit" signals at 1 times Risk when achieved following the Signal Pattern. The "Trading Plan" assumptions are:
Risk = HIGH(0) - Low(0)
Entry = Low(0)
Stop Loss = HIGH(0)
Profit Target = 1 x Risk below Entry
1 x Risk must be achieved within 7 Bars following the Signal Bar, obviously without the Stop Loss being hit.
Note: for simplicity no allowance has been made for an Entry Stop Offset or a Stop Loss Offset.
I've added scripts and Chart Elements to count the Signal, Entries and 1R Profits.
This forum is for helping Optuma users develop their own scripts, not provide custom scripts for every purpose for free.
As an Optuma user, and not an Optuma employee, I’m happy help to help those that work to help themselves learn Optuma scripting and to help others, but I’m not prepared to be a totally free scripting service.
If you want scripts and are not prepared to work on the development of them yourself, then I suggest to contact Optuma’s Consultancy Service and pay to have them developed for you.
Mohd - please see the pinned thread at the top of the scripting page for an explanation of what to expect from the forum. If you would like to arrange a consulting session see here: