I'm new to Optuma scripting, so this is probably a dumb question. How do I find the HighestHigh (or LowestLow) for a prior period, like last year or a rolling period ending 12 months ago for example?
Also, is there a web page that briefly describes every formula available?
will plot a line on your chart showing the highest high within the last 66 bars, or about 3 months.
For Yearly Highs/Lows you can use the standard Optuma Tool "Year High Low Marker". Here's a screenshot with both on it:
As to your request for details of scripting functions, take a look at Formula Functions & General Interface as a starting point, then search for other Optuma Knowledge Base articles on the subject of interest to you.
Thanks for getting back so quickly, really appreciated. I've been through all the scripting videos and read through much of the KB; I am excited by the opportunities.
With the scripting tool, there's just so many similarly named options, it's difficult to get one's head around it. A searchable KB would be fantastic - but I know from personal experience that's not easy to achieve when you've started down another path.
Sadly, I haven't explained my problem well enough. I saw the Optuma "Year High Low Marker" tool and wanted to make more specific use of the calculations behind it.
What I'd like to be able to do is to find the HighestHigh, or LowestLow, for a period that excludes the immediate past. If I could write something like this I'd be able to achieve what I want.
If I'm reading your requirements of your script outline correctly you are looking at doing this:
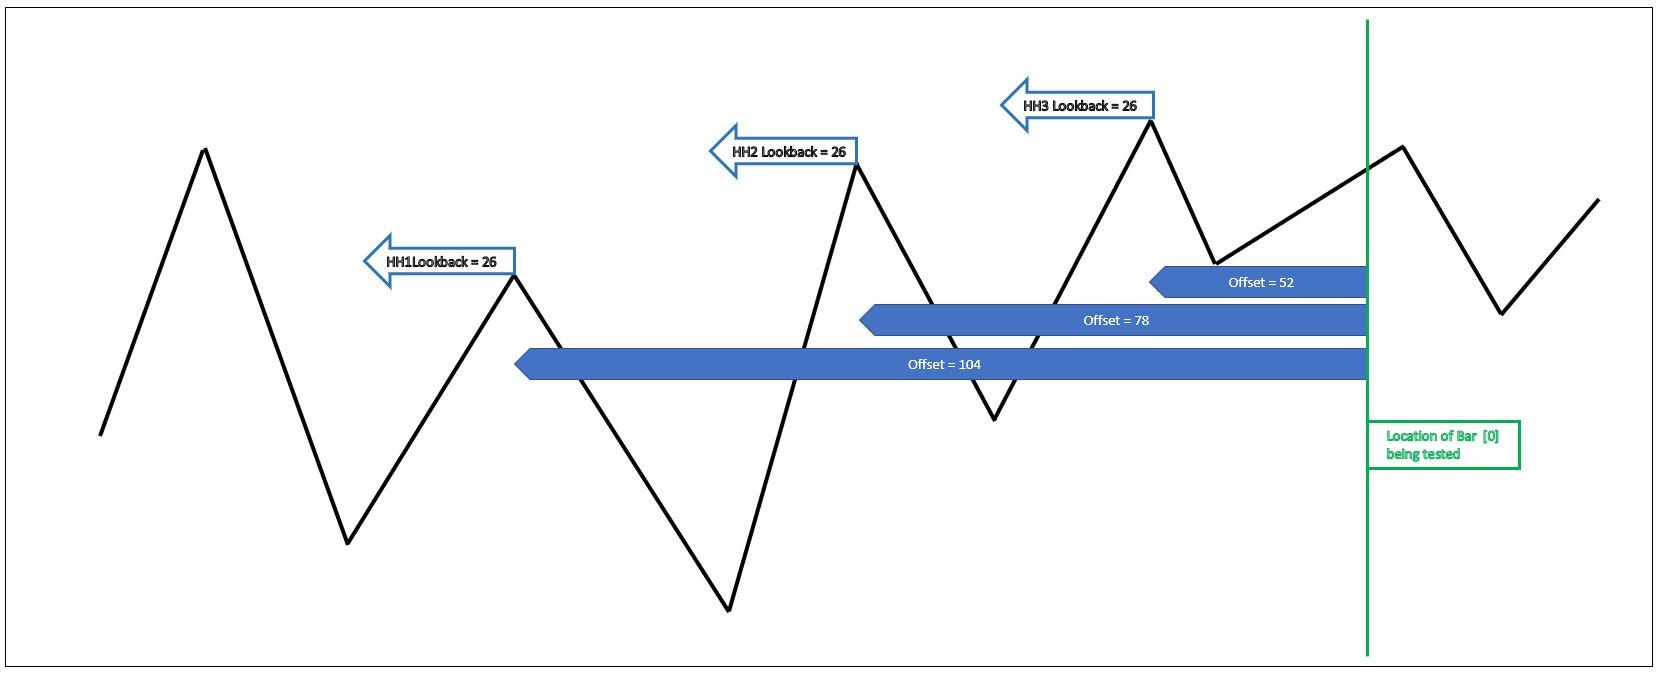
As I understand how it all works, the positive Offset parameter as set in the square brackets "[]" works backwards from the bar being evaluated, moving forward and testing each Bar from the earliest Market Bar (not the earliest displayed bar) to the latest Market Bar. That determines the points for your HH#s with their Lookback parameter, from which the HH# looks for the Highest High within the previous LookBack Bar range, ie within the previous 26 Bars. If the script requirements are met then a SHOWBAR signal occurs at the bar being tested. The diagram I've included above would not be highlighting a Bar as having met the criteria. If I've got that description of how the functions work screwed up I trust Darren will correct me.
Which can be done with the following script:
HH1 = HIGHESTHIGH(BARS=26)[104] ;
HH2 = HIGHESTHIGH(BARS=26)[78];
HH3 = HIGHESTHIGH(BARS=26)[52];
Signal = If ((HH1 < HH2) and (HH3 < HH2), 1, 0);
Signal
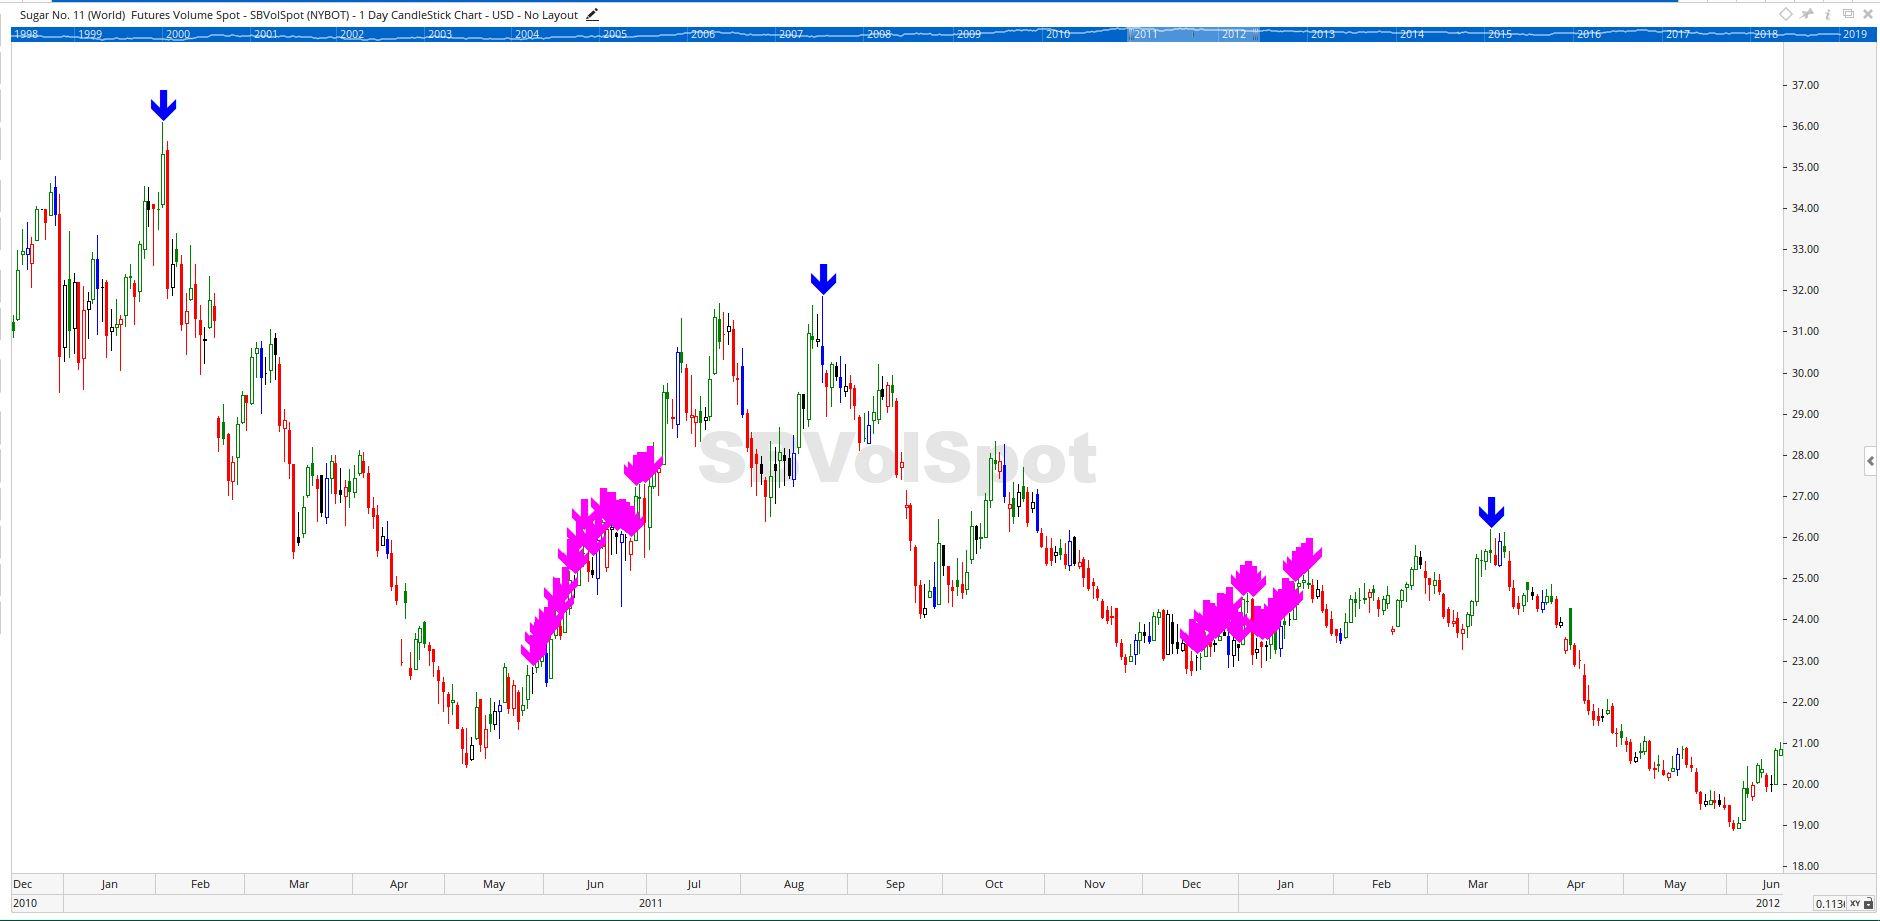
This produces the following result (Magenta SHOWBARS), however I don't think that is what you are expecting
If what you are really looking for is the High that has no other Highs within 52 Bars each side of it then the following script will do that:
Pivot(MIN=52, TYPE=High, DIR=Both)
The Signals produced by this script are the Blue SHOWBAR Arrows in the above screen shot.
Hope that helps with what you are trying to achieve, and also your understanding of how the script functions work.
I can see how this could be important. I’ve added a “Range” option to the HighestHigh function. When selected you can choose the start date and end date. The highest value within that range will be projected forward to the end of the chart. In the image below the range is Jan 9 2018 to Aug 1 2018. The arrow shows where the testing ended.
Hopefully this will do what you are after. It will be included in a Beta update in the next week or so.