I am using a Show Bar tool. It is set to line and shades over the bar when a specific signal occurs. I would like the line to shade the chart forward, say 100 bars from the initial signal. How would I do this?
Hi Darren. Thank you. My apologies for not being clear.
I am looking for a signal to be visible on the chart the day it is triggered and the following following 99 days.
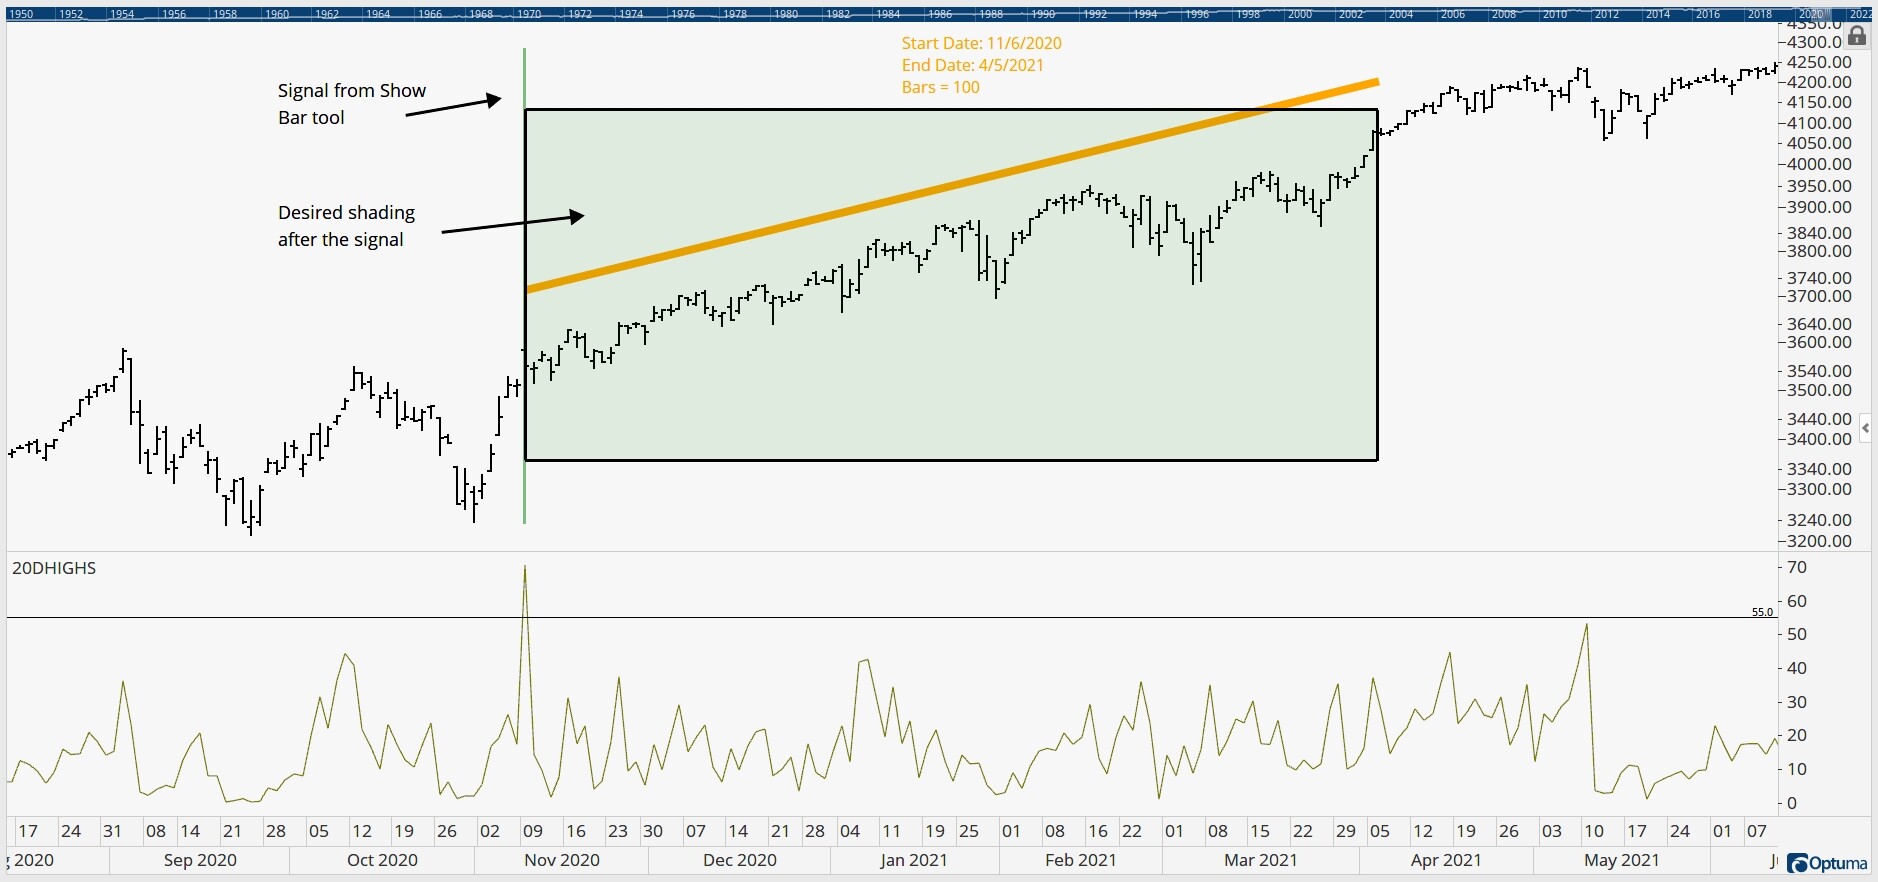
Please see the attached picture. The green line is the initial signal from the show bar tool. The green box is the time I would like be shaded in addition to the shading on the day of each signal. I hope that helps. I can’t find anything in the forum. Sorry, and thank you.
It will count from every time the signal was true, so there may be overlaps if the signals occurred within 100 days of each other. As such, it will extend 100 bars from the last signal: