Hi,
I am wondering if anyone has been able to script for a show bar the Hindenburg Omen for the DJI, S&P 500 and the XJO?
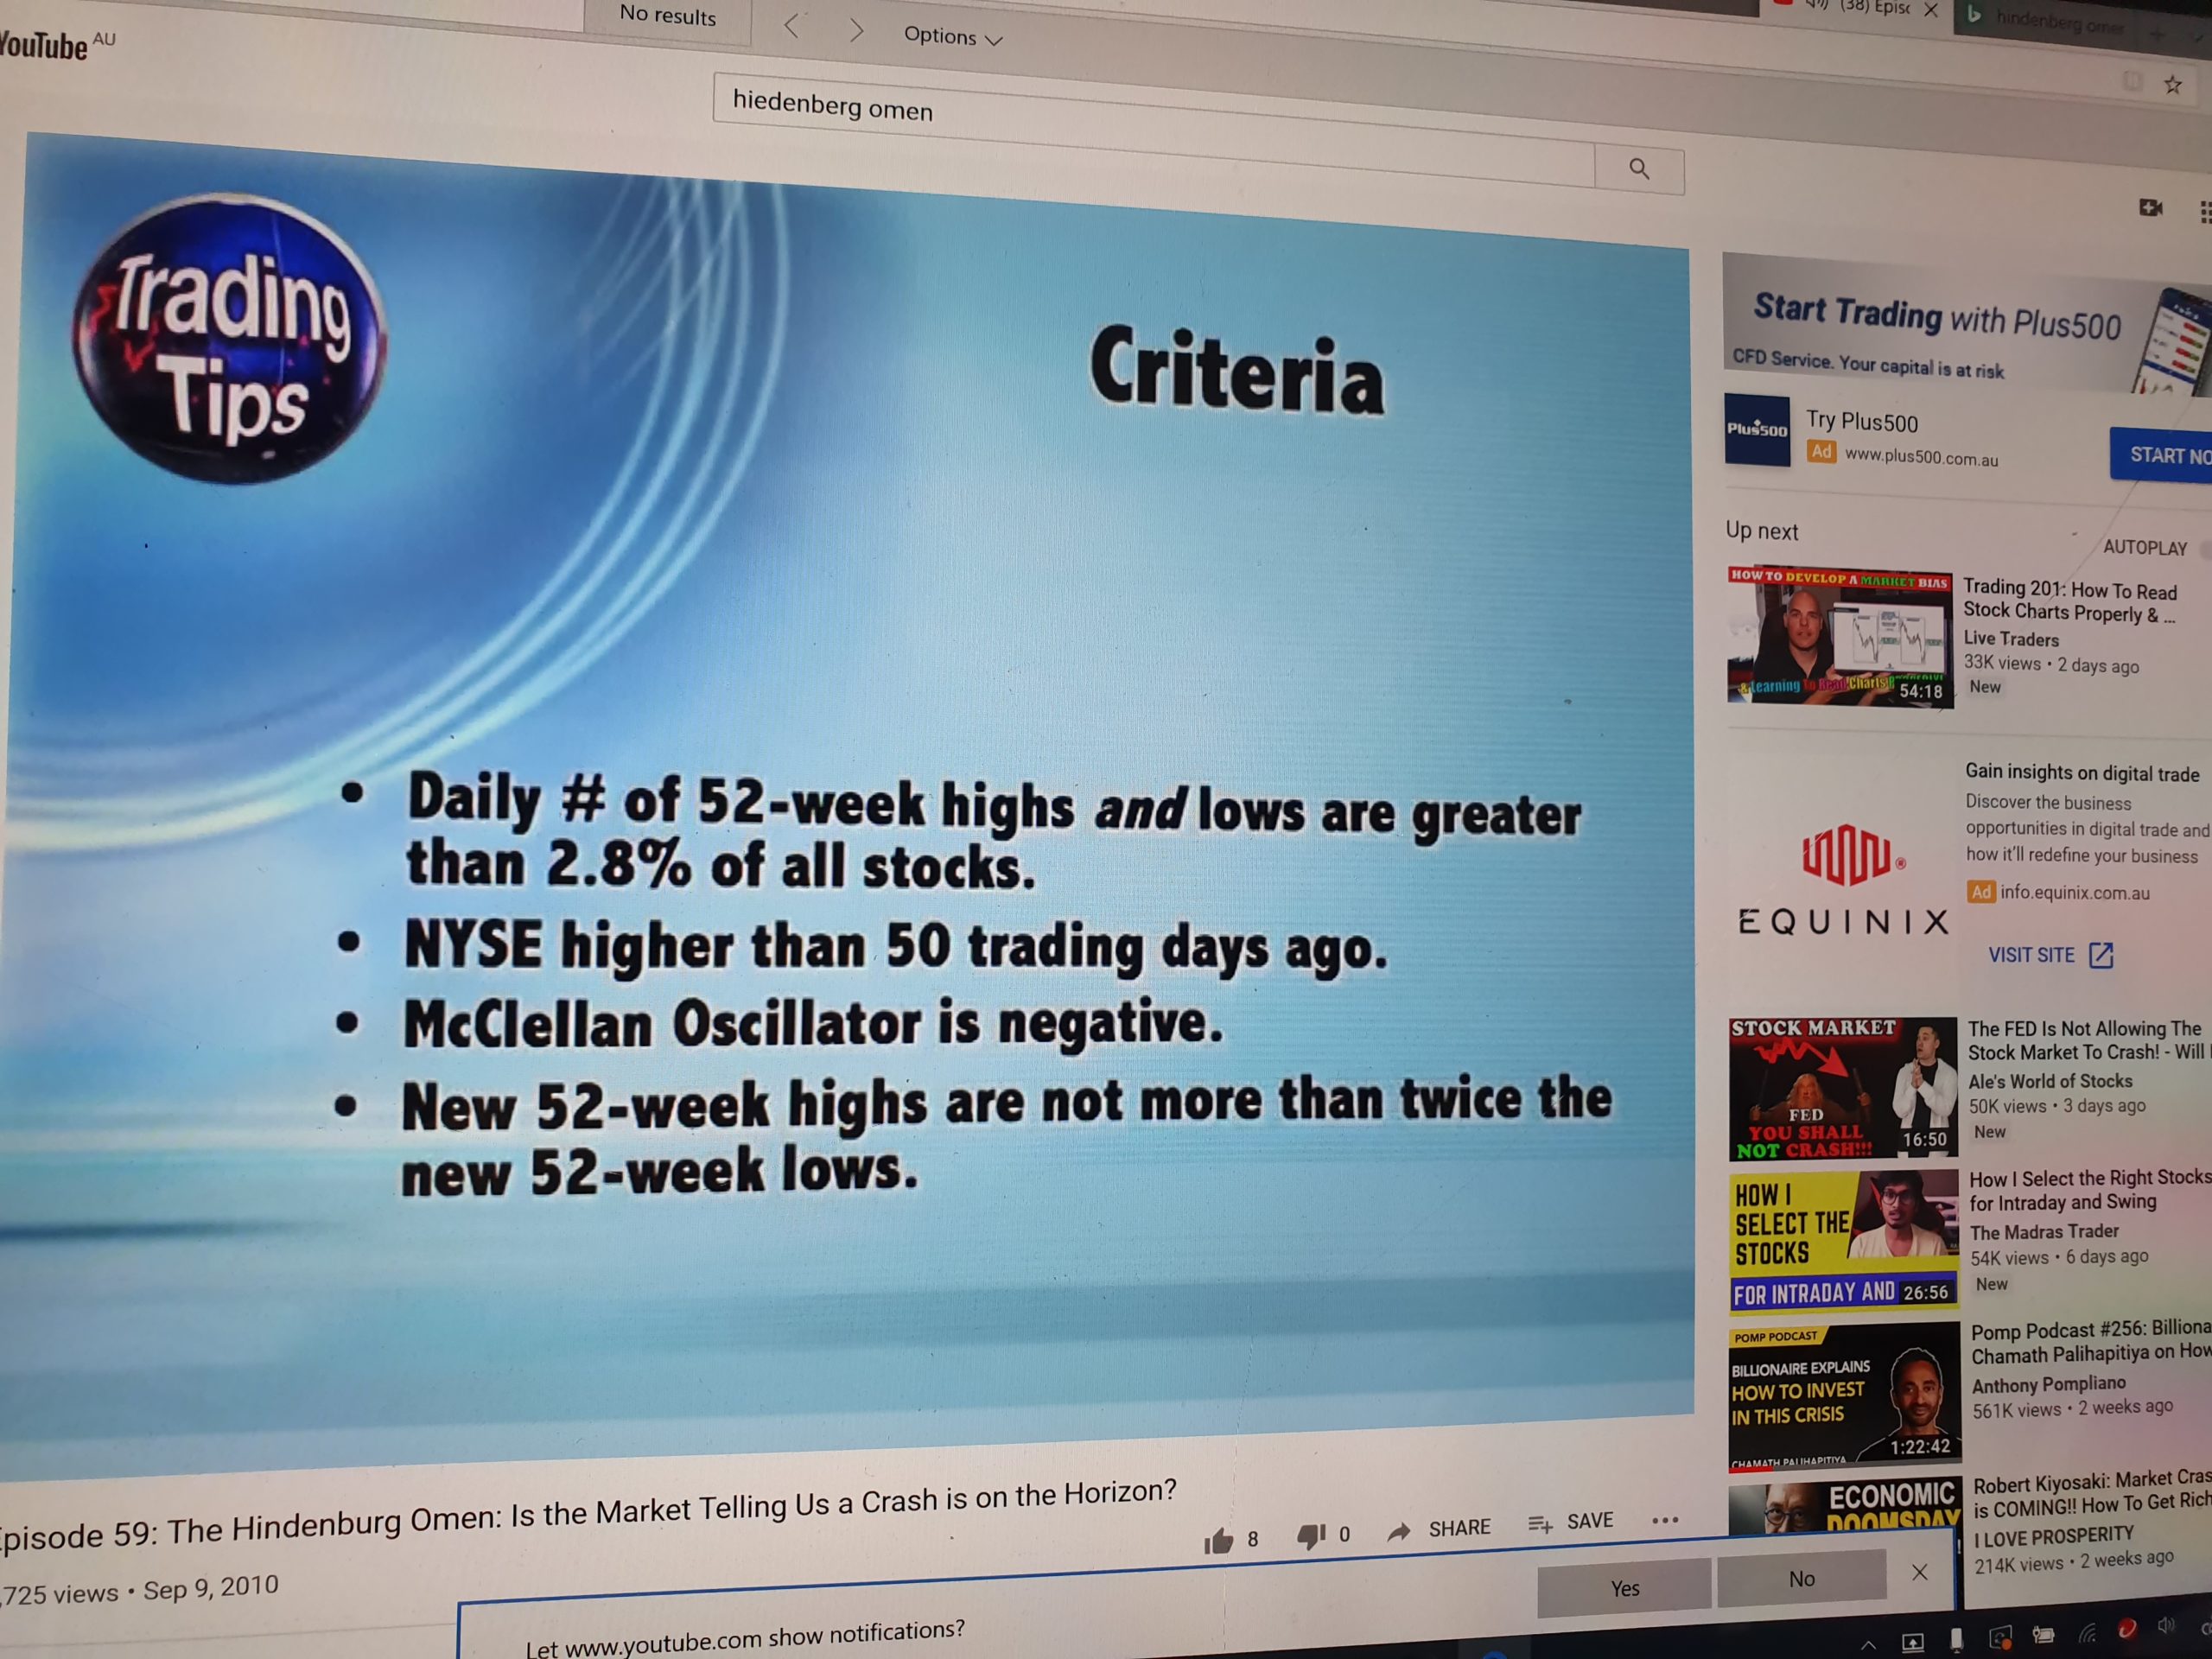
The Hindenburg Omen is a technical indicator that was designed to signal the increased probability of a stock market crash. It compares the percentage of new 52-week highs and new 52-week lows to a predetermined reference percentage to predict the increasing likelihood of a market crash. Named after Germany’s Hindenburg airship that crashed on May 6, 1937 it was conceived and promoted by James R. Miekka. It would have been a good show bar to have popped up a few weeks ago and I’m trying to implement it now.
The rules that are required to be scripted are in the attached document.
I have attempted a start but I can’t get the breath indicators to work for those 3 indices. I would be grateful if someone could assist with the scripting as this is beyond my capability. My start of the coding is below but you may wish to start afresh.
Thanks,
Karen
//Source DJI Data
V1 = GETDATA(CODE=DJI:WI)
//Daily number of 52 week highs
V1 = GETDATA(CODE=DJI:WI)
V2 = BREADTHDATA()
//Number of all stocks in DJI
///McClellan Oscillator
//Source Data for NYSE Advance and Declines - need to change for DJI but can’t see equivalent code
D1 = GETDATA(CODE=ADVNYSE:BM);
D2 = GETDATA(CODE=DECNYSE:BM);
//Setup 19EMAs on AD Codes
A1 = MA(D1, BARS=19, STYLE=Exponential);
A2 = MA(D2, BARS=19, STYLE=Exponential);
//Setup 39EMAs on AD Codes
A3 = MA(D1, BARS=39, STYLE=Exponential);
A4 = MA(D2, BARS=39, STYLE=Exponential);
(A1 - A2) - (A3 - A4)
///McClellan Oscillator is negative
///52 week highs are not more than 2 times 52 week lows