Hi guys, I've a request for a simple copy and paste tool.
The ability to copy a period of historic price action or more specifically the candles themselves, to create a 'Ghost' of the pattern created during that period. Then paste the copy over current price action for comparison purposes. Very handy on Forex and is available in other packages.
Once pasted, the 'ghost' should have hot spot drag and stretch features, meanwhile maintaining internal scale proportions. This tool needs to be fractal and should be able to copy between charts/symbols or workbooks.
It’s a terrible name, but have a look at the tool called “Scaled Boxes”. Draw the first box with two click around the data that you want to repeat. A duplicated box will be drawn over the end of the data. Then you can move either box around and also rescale the duplicated box.
Also have a look at the Historical Comparison Chart - you can put the same ticker in with different dates. You can read more about that here https://help.optuma.com/kb/faq.php?id=986
Mathew, this is similar to a request I was going to make but it is more for scanning purposes. You select a pattern (portion of data) on the screen and then it creates a template in which to scan against to find similar patterns.
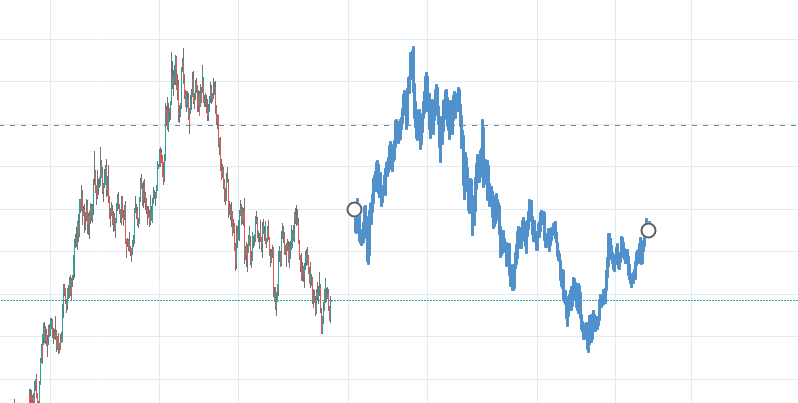
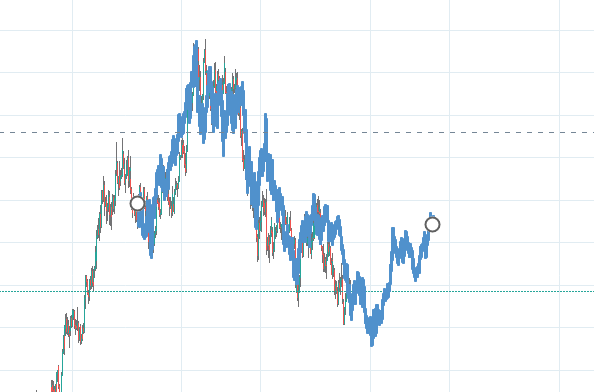
We have a tool that may do this for you. It’s called “Pattern Matcher”. In the image it is the blue box. I selected the area of the market that I wanted to match. It identifies swings based on your choice of rules (Gann, Volatility, percentage or pivots). In the blue box you can see the two swings that it identified. Following that you can see an exact match in green and an inverted match in red.
The thing with this tool is that is reduces the swings to a Pattern String - here is the one for this pattern {“PATTERNS”:[“110,-85.38”]}
This one is simple it is looking for a 110% pattern in time and a 85% pattern in price. Although in the properties I told it to match on price only (so the 110 is being ignored).
At the bottom I have the results of a scan
If we look at APH, we are within the 10% threshold I had set on the tool. I’m using a TPL tool (Time Price Label) if you ever use that one, go to the actions and select “Add New Label” then it shows retracements etc.