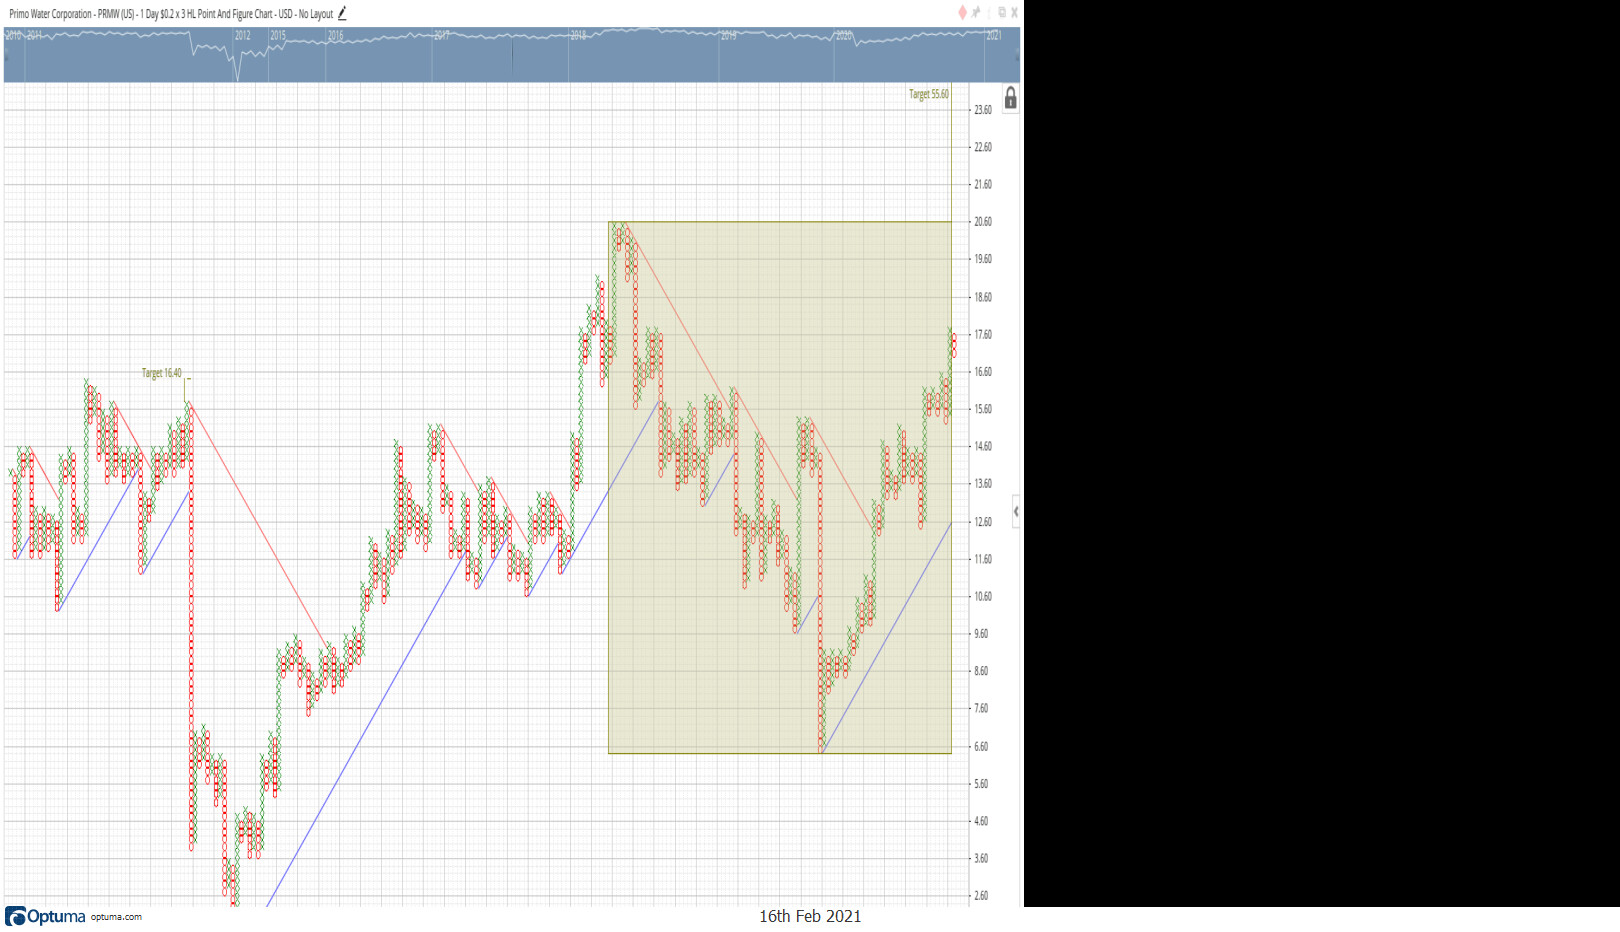
I created a Point and Figure chart with more than a year’s data and I cannot figure out how to zoom in and out of the chart. All that I see is the recent data displayed and the rest goes off the screen. How do I take control of the amount of PnF that displays on my chart, since it doesn’t have the Time/Price Ratio like the bar charts have. Also the price scale on the right doesn’t display. The blue time line at the top of the chart doesn’t display. In other words there is no time and price scales on the PnF chart.
Hi David,
P&F charts are geometric in their construction, so they don’t have a Time/Price ratio. As such, some of the chart data may go off the screen when you roll your mouse wheel to zoom in (note: changing the box size from $0.75 will change the dimensions of the chart). You can click and drag the chart to re-position.
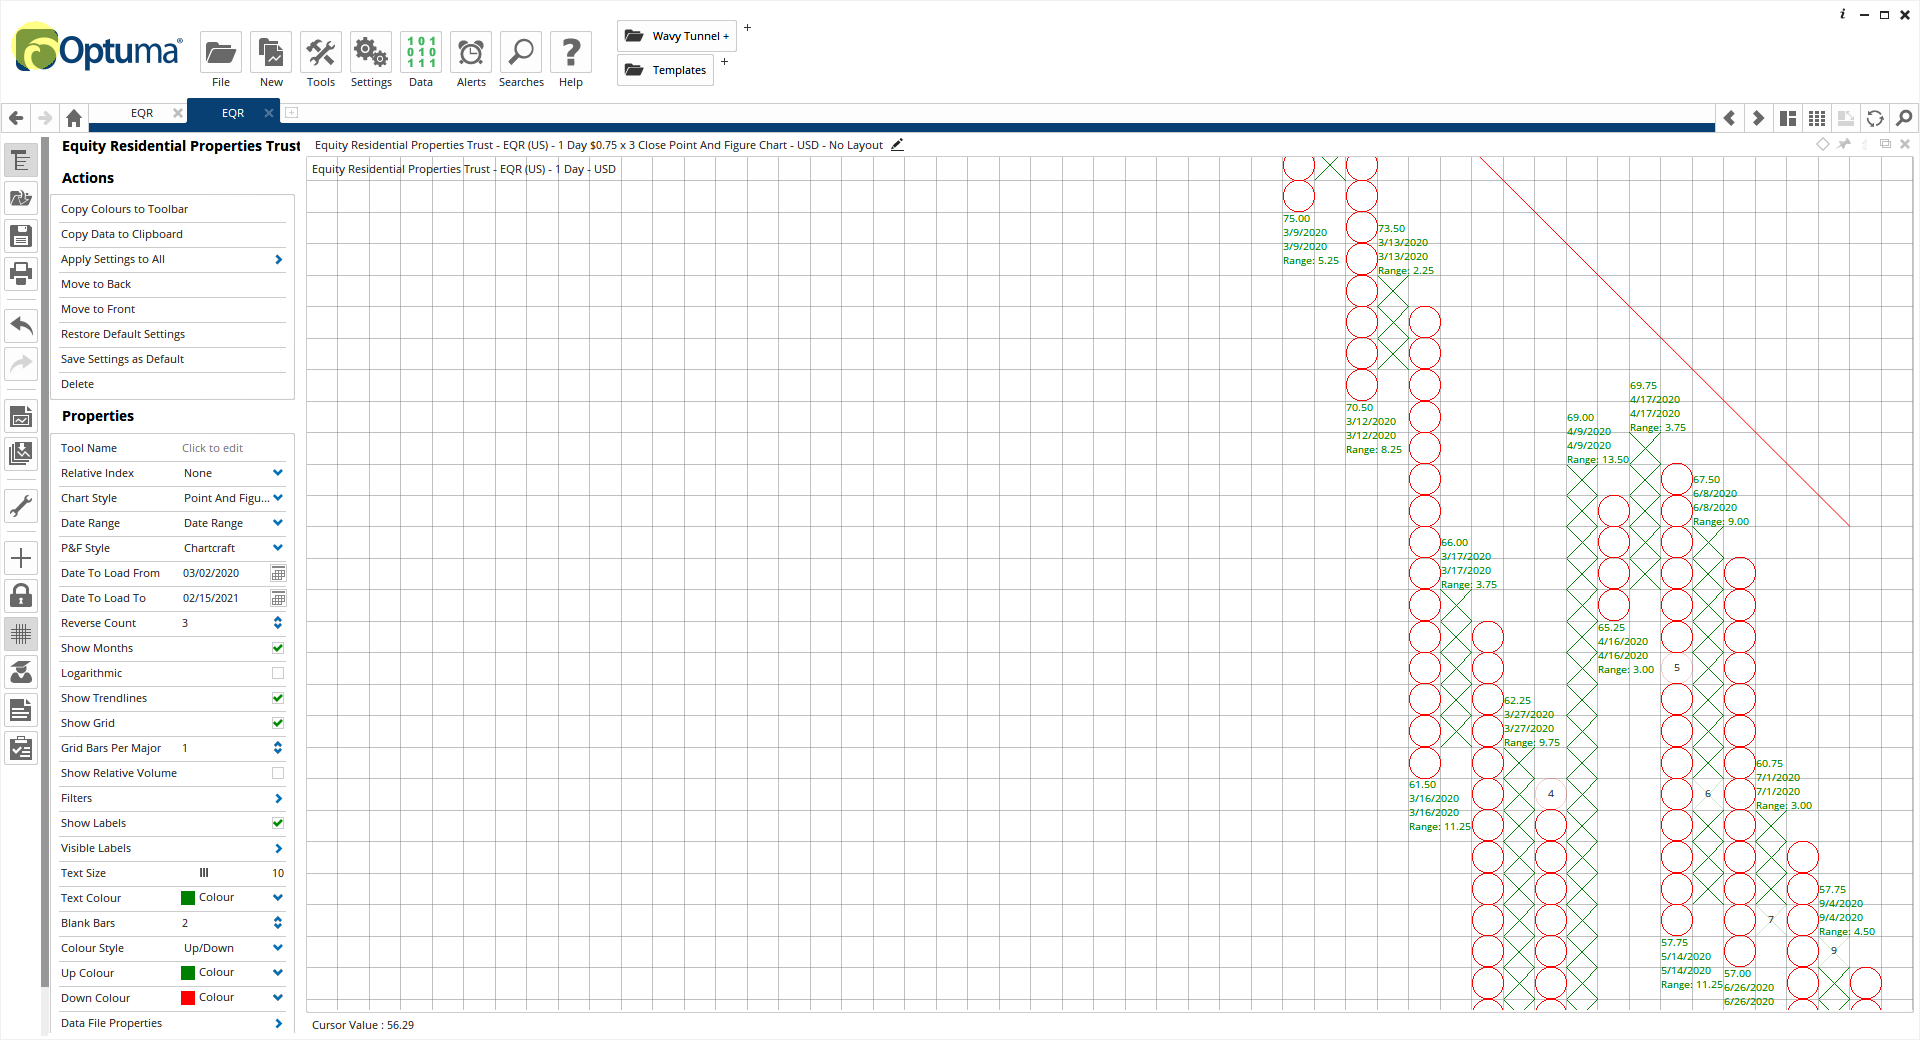
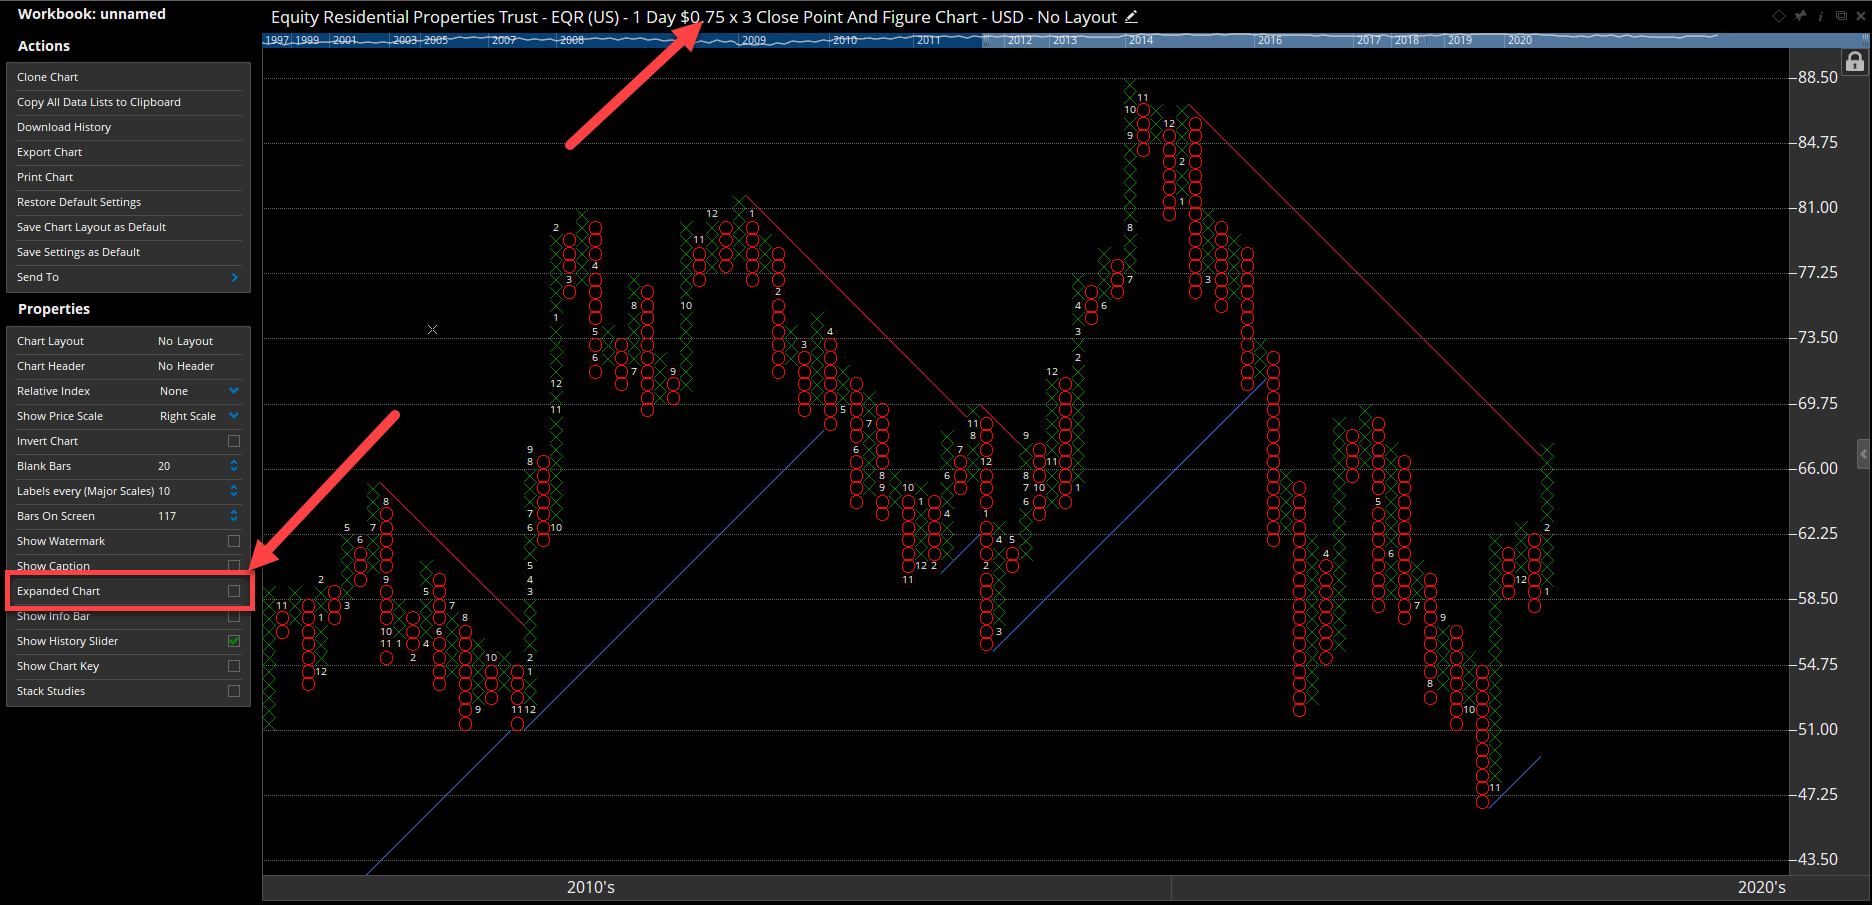
However, you should be seeing time and price scales so click on the chart background and make sure that the Expanded Chart option hasn’t been accidentally enabled in the properties:
Thanks for your reply. One more question on this. The PnF target count give a possible future price and I’m wondering which of W.D. Gann’s methods could forecast when this will happen? I’m not asking how to do Gann’s calculation, but I just need to know which method would estimate when this might happen.