I have a trend indicator that should have the value of “1” when the raw values of the calculations is greater plus 0.3 and it should have the value “-1” if the raw values of the calculations is greater minus 0.3. The range between plus 0.29 and minus 0.29 should be ignored or have the value “0”.
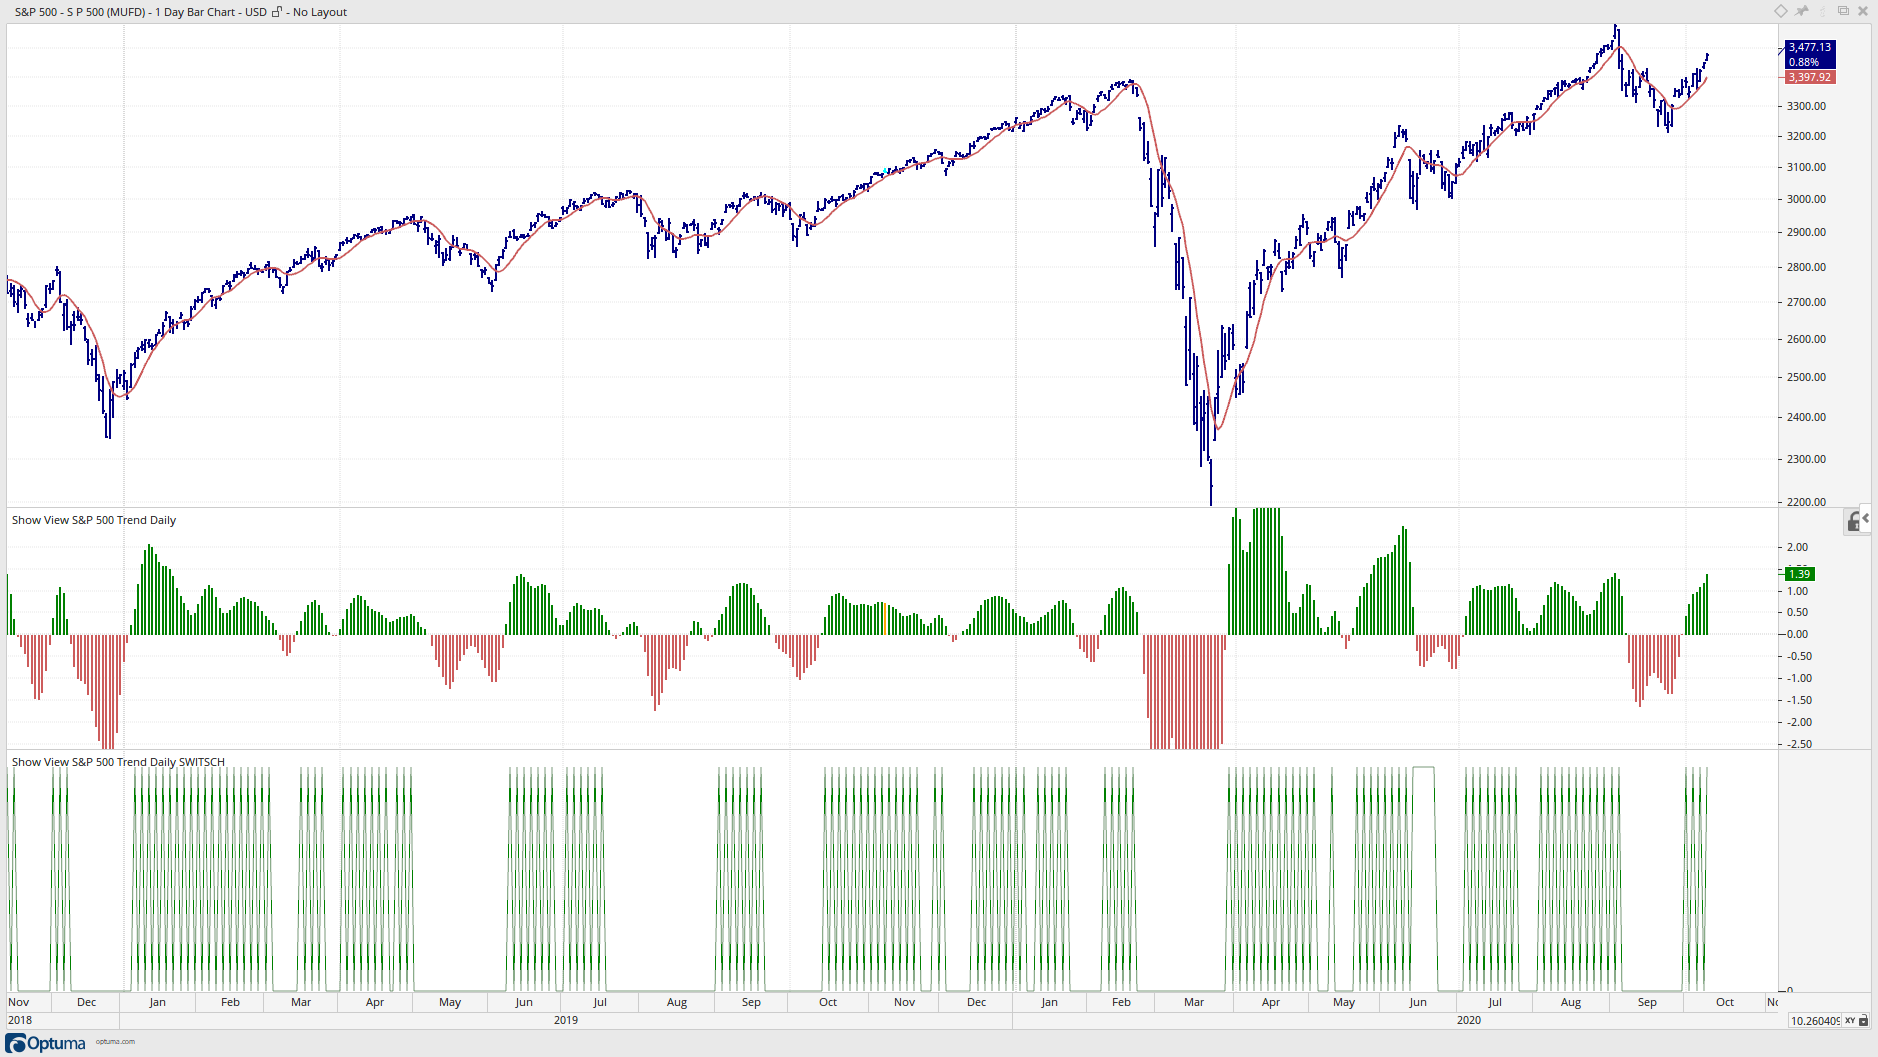
many thanks for your fast response. But the issue seems to be more complicated than thought. Here is the screenshot of the chart:
As you can see there are numerous times when the tool moved from “1” to “-1” although it shouldn’t or stayed at “0” although there was no reason to stay there.
For example in the time period between mid October 2019 to mid January 2020 the value of the trend indicator should be always at “1”. The same is the case in the time period between end of March 2020 and mid June 2020 it should be a value of “1”. And so on.
To make my issue a little bit more clearer:
If the raw calculation (the histogram or Var3) moves from a negative value to plus 0.3 or more the trend value should be “1” at the first bar that has a raw calculation of plus 0.3 or more and this value of “1” should be in effect until a raw value of minus 0.3 or more is reached.
On the other hand, if the raw calculation (the histogram or Var3) is positive and moves to minus 0.3 or more the trend value should be “-1” at the first bar that has a raw calculation of minus 0.3 or more and this value of “-1” should be in effect until a raw value of plus 0.3 or more is reached.
It’s a little hard without all the information on the other plot. You are comparing this to a plot which we do not have the script for so we can not see why one would be going negative and the other not. Unless I am not understanding why you are highlighting the two plots.
One thing I did notice is that both your and Trevor’s scripts will go to 0. The issue is that a nested IF gives you three states but you only want two. Also you have “>=” for both tests in your if statements.
Using a switch is a much better way to achieve what you are looking for and using a crosses is also better as we want a “switch” condition rather than a “state” condition.
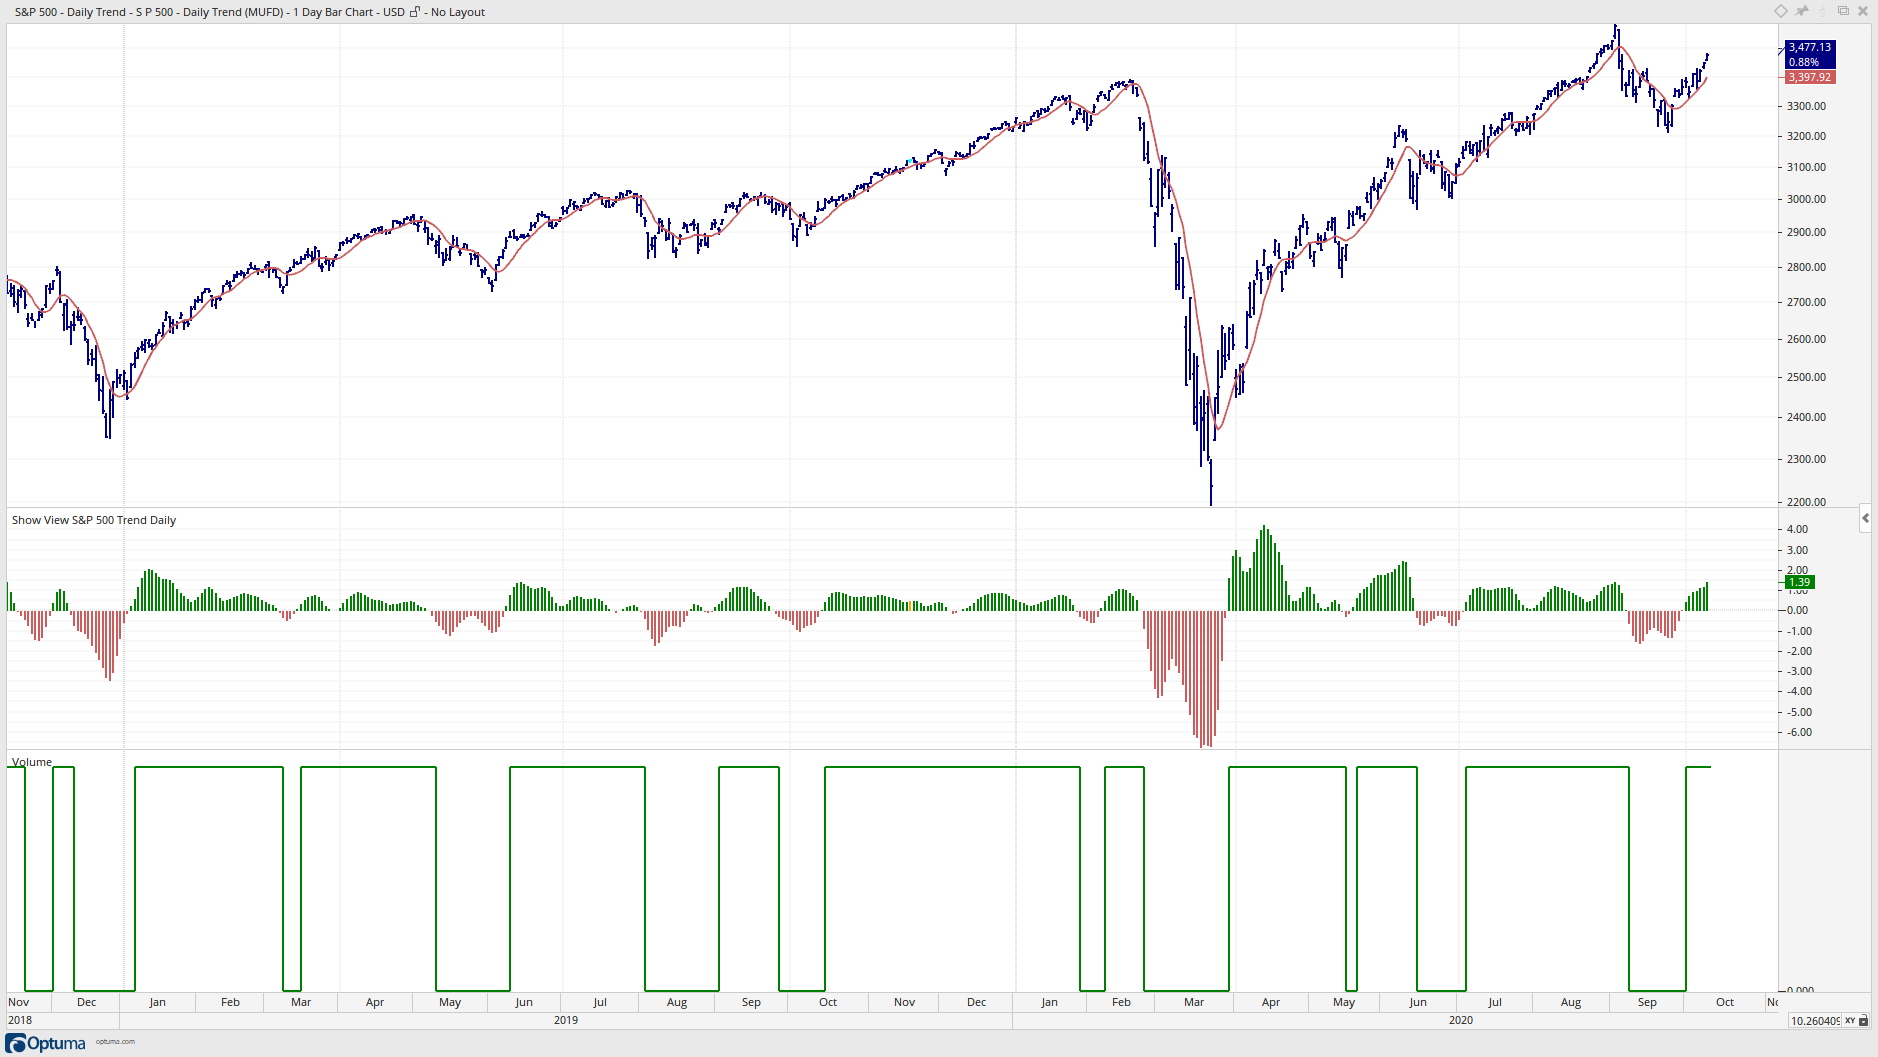
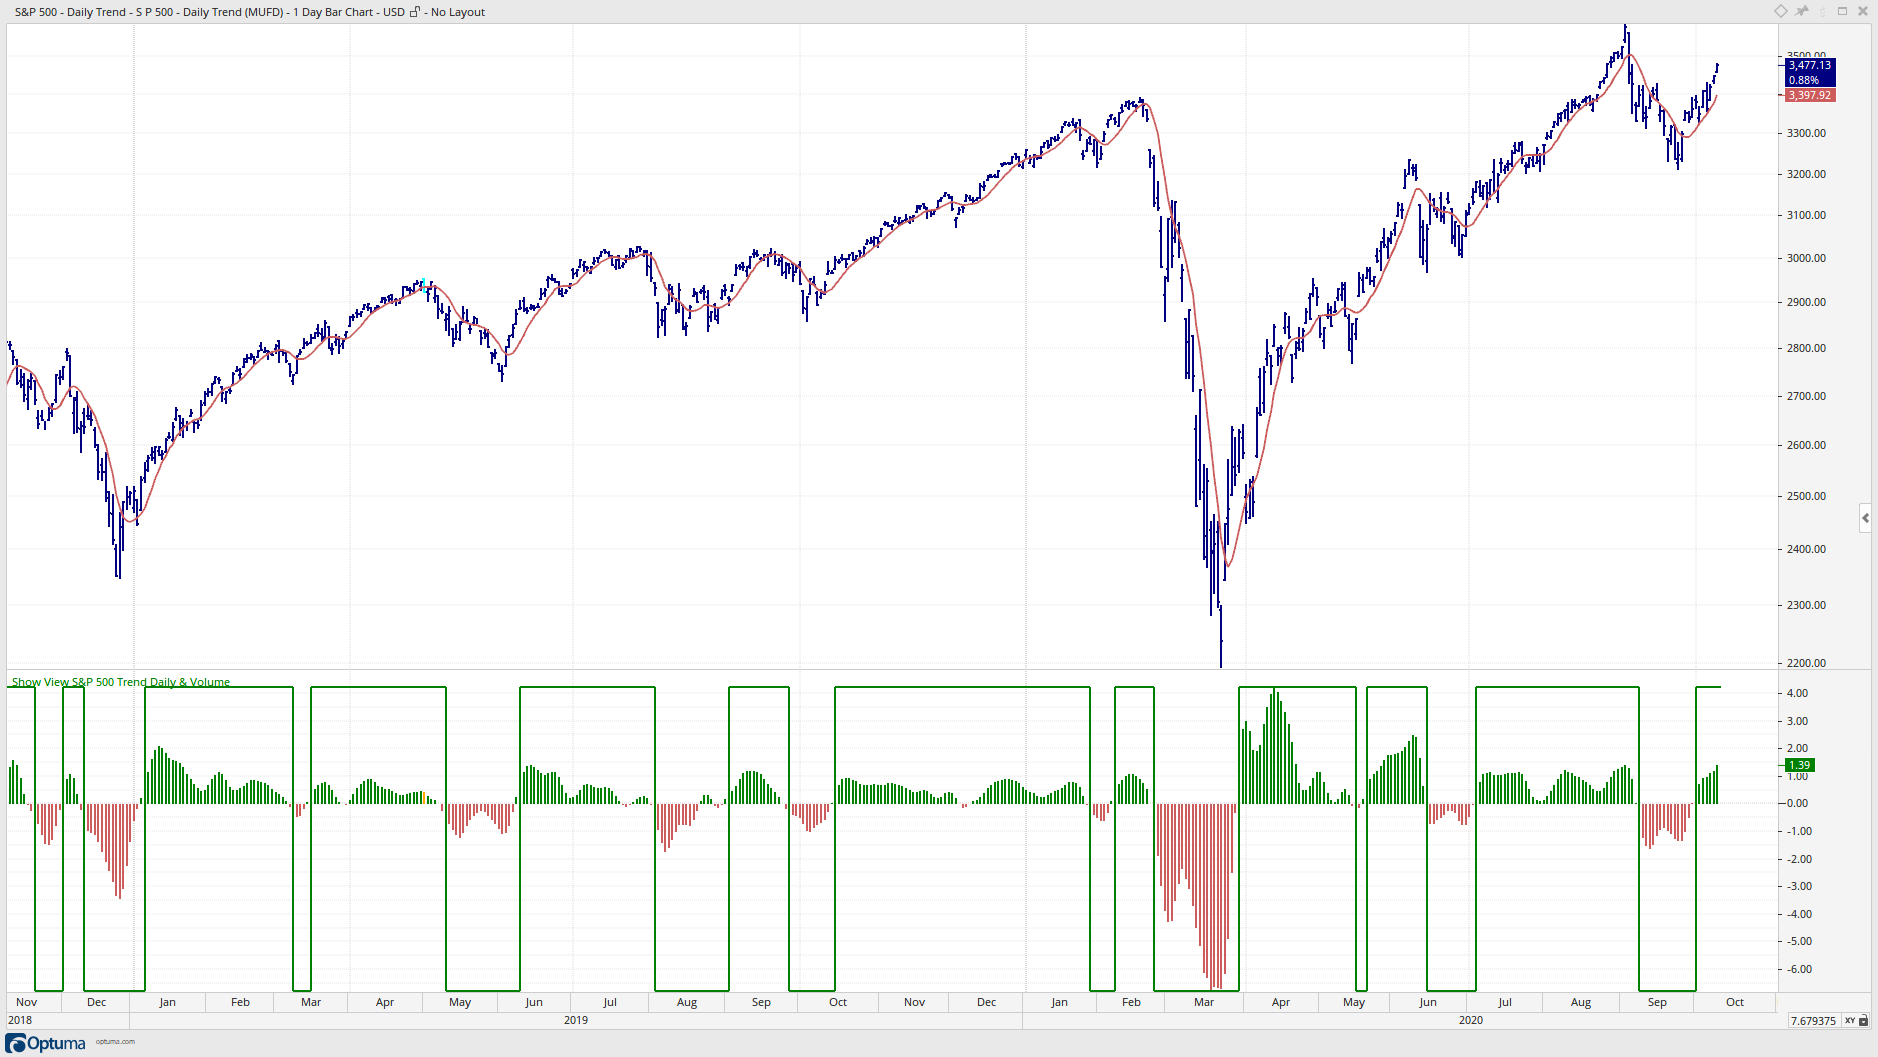
I have done the job in Excel, the Excel file is attached. Here are the charts how it should be.
I have saved the trend values “1” and “0” in the volume column of the csv file and then have displayed the “volume” in Optuma. The volume is the trend indicator. The csv file is also attached.
Here are the description what the trend indicator should do and how it is calculated:
Var2: I calculate a 8 period Exponential Regularization Moving Average
Var3: Percent change of the Exponential Regularization Moving Average over the last three days
Var4: The trend indicator should have a value of “1” as long as Var3 is above minus 0.3 and when the Var3 is negative more than minus 0.3 the trend indicator should have the value “0” as long as Var3 is below 0.3.
When Var3 moves the first time above 0.3 and the trend indicator value was the bar before “-1” it turns to “1”.
When Var3 moves the first time below minus 0.3 and the trend indicator value was the bar before “1” it turns to “-1”.
The problem is the range between 0.3 and minus 0.3. This is the range where often whipsaws occur and to remove these whipsaws makes the issue a little bit complicated.
I hope I have clarified the issue, if not please let me know.