How do you create the script for an indicator of an indicator, such as Stochastic of RSI?
https://www.optuma.com/videos/how-to-apply-indicators-on-indicators/
V1 = RSI(BARS=14);
STOCH(V1, BAR1=10, BAR2=3)
Thanks Jamie. Also, see the first video here on Nested functions:
Thanks for the info!
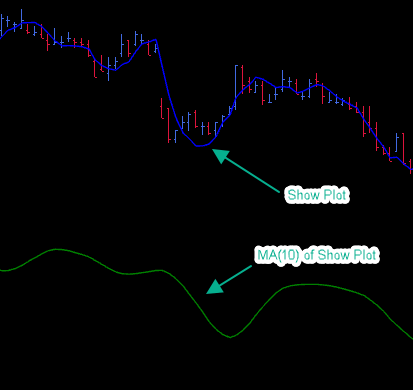
I’m trying to apply indicators to a Show Plot script that I have made, but am running into some issues.
The Show Plot script is:
var1 = LRSLOPE(BARS=10);
var2 = LRINT(BARS=10);
(var1*10)+var2
When I apply a MA(10) I would expect it to plot along the Show Plot, what I get is in the attached.
I am also trying to add a PSAR to the Show Plot, it appears to plot the downward dots well, but puts the upward dots at or below zero on the Y axis.
Hi Ben,
Some functions have hidden Highs / Low values that don’t appear in view but can effect tools that reference them, when adding a tool to a single value plot like this i always recommend setting the calc style to Close only.
If you adjust the Moving Average (applied to the Show View) to use the Close only in its properties, it displays as you would expect.

With the PSAR script, i can’t repeat the issue you are using. Can you include the script and a screen shot of the result. (I am using PSAR().PSAR to test with)
Thanks for your help Matthew! Have got the MA and PSAR working.
Fixed the PSAR issue by setting the Show Plot formula as a variable nested inside a CLOSE() function as you recommended for the MA.
Many Thanks!
var3 = CLOSE((var1*10)+var2));

PSAR(var3).PSAR