Hi Optuma team,
I have a feature request regarding the property “Invert Chart”.
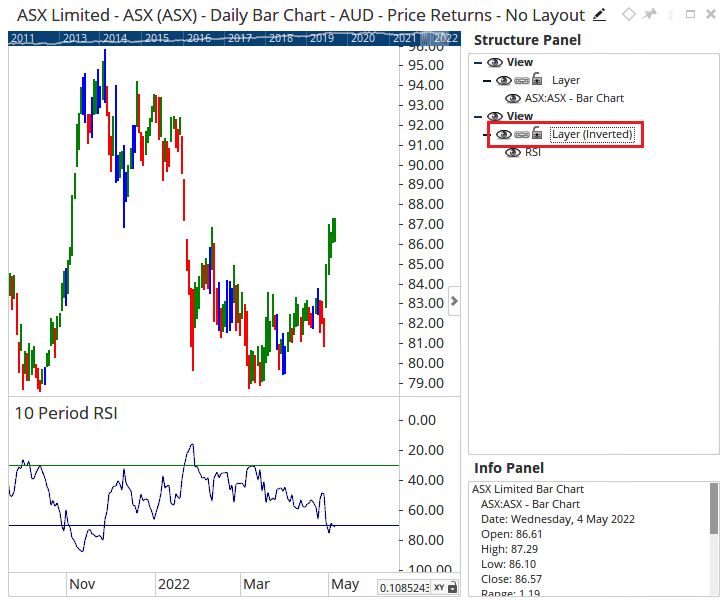
At the moment the property “Invert Chart” is a general chart property that means only the “main chart” can be inverted but not “lines” in windows below the main chart.
I would therefore recommend moving the “Invert Chart” property to the “Price Scale Properties” so that each individual line in a window can be inverted…
Here is an example where an individual “Invert Chart” property in the the “Price Scale Properties” would be helpful.
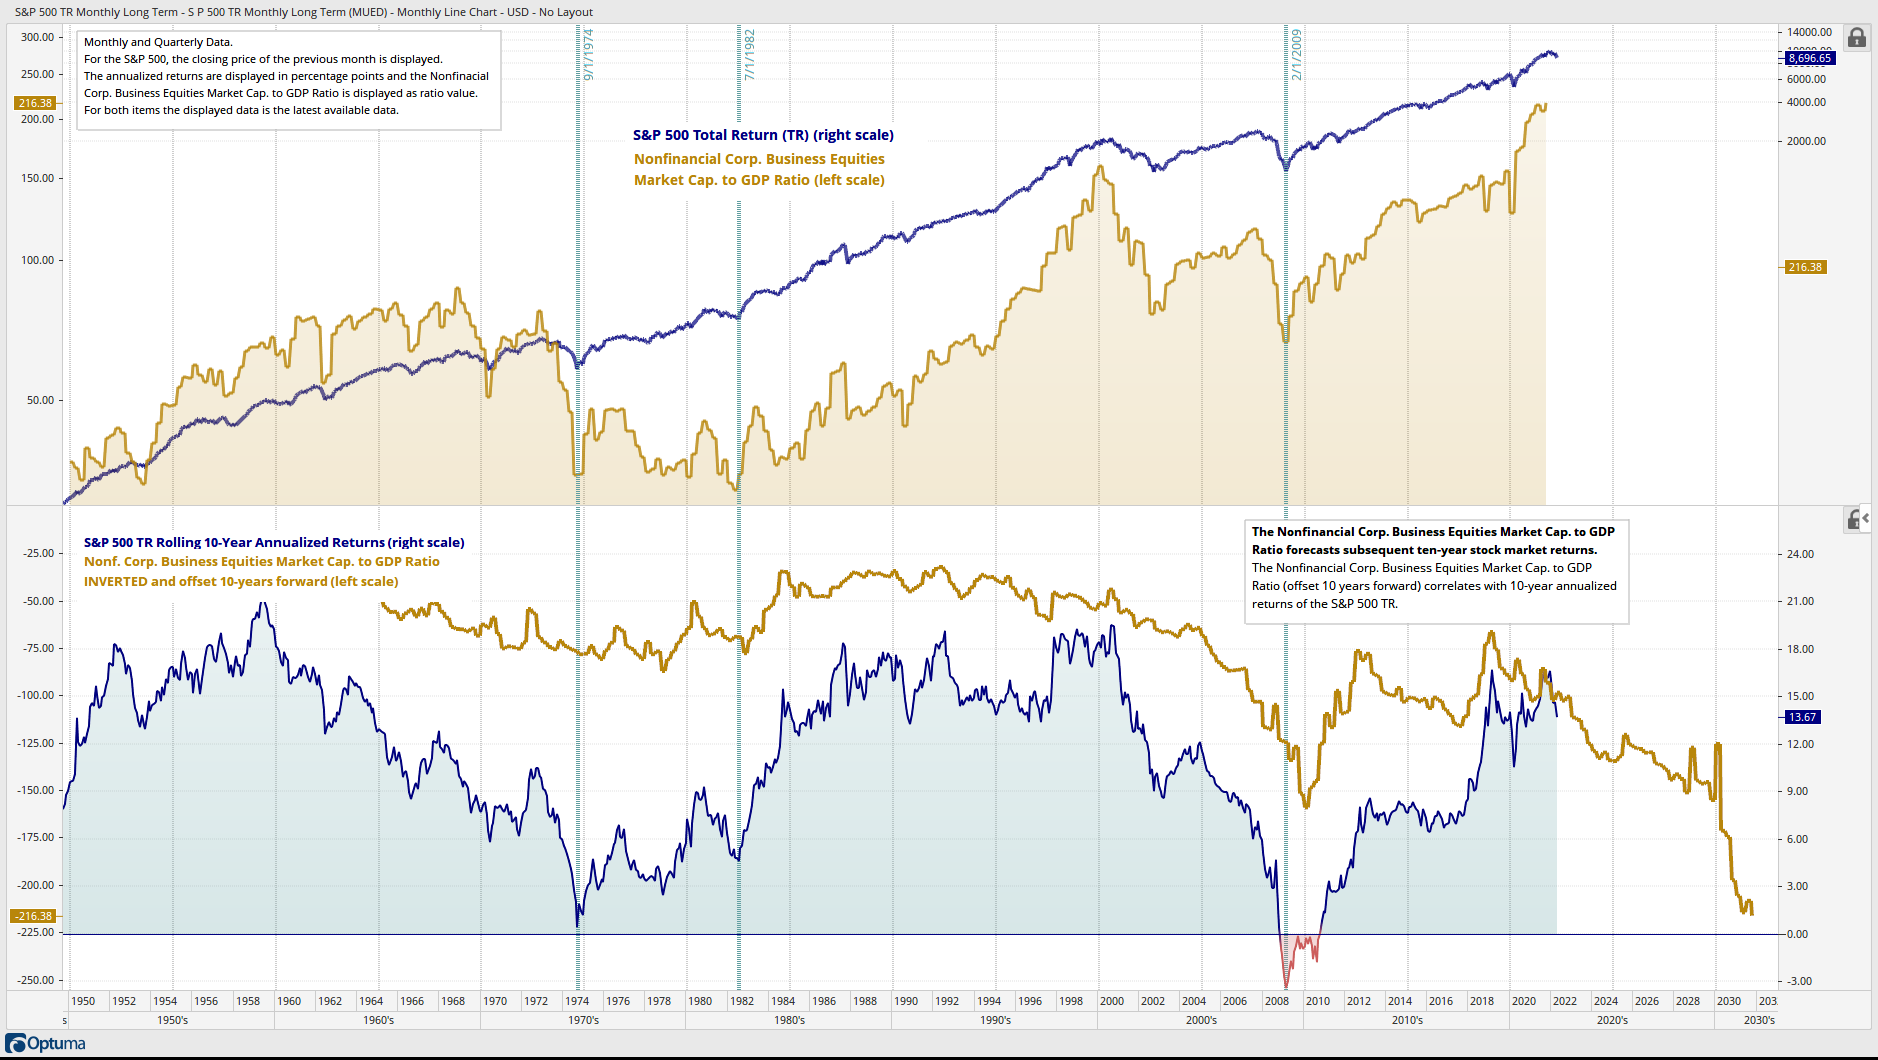
As you can see, I manually inverted the brown “line” in the window below the main chart using a simple script.
BUT because of the manual inversion (multiplying the raw values by -1) I have negative values. This is not a problem as far as it goes, but with negative values it makes no sense to scale the axis logarithmically.
However, in the above diagram, it would make sense to scale the left scale logarithmically to “improve” the visual “look” of the brown line.
If it were possible to scale the left scale inversely, it would be possible to scale the left scale logarithmically as well. To do this, it would be necessary to move the “Invert Chart” property to the “Price Scale Properties”.
I hope I have been clear in my description, if not, please let me know.
Best wishes,
Thomas