Script giving errant results - where did I go wrong?

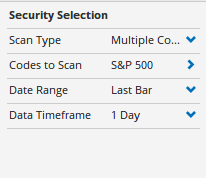
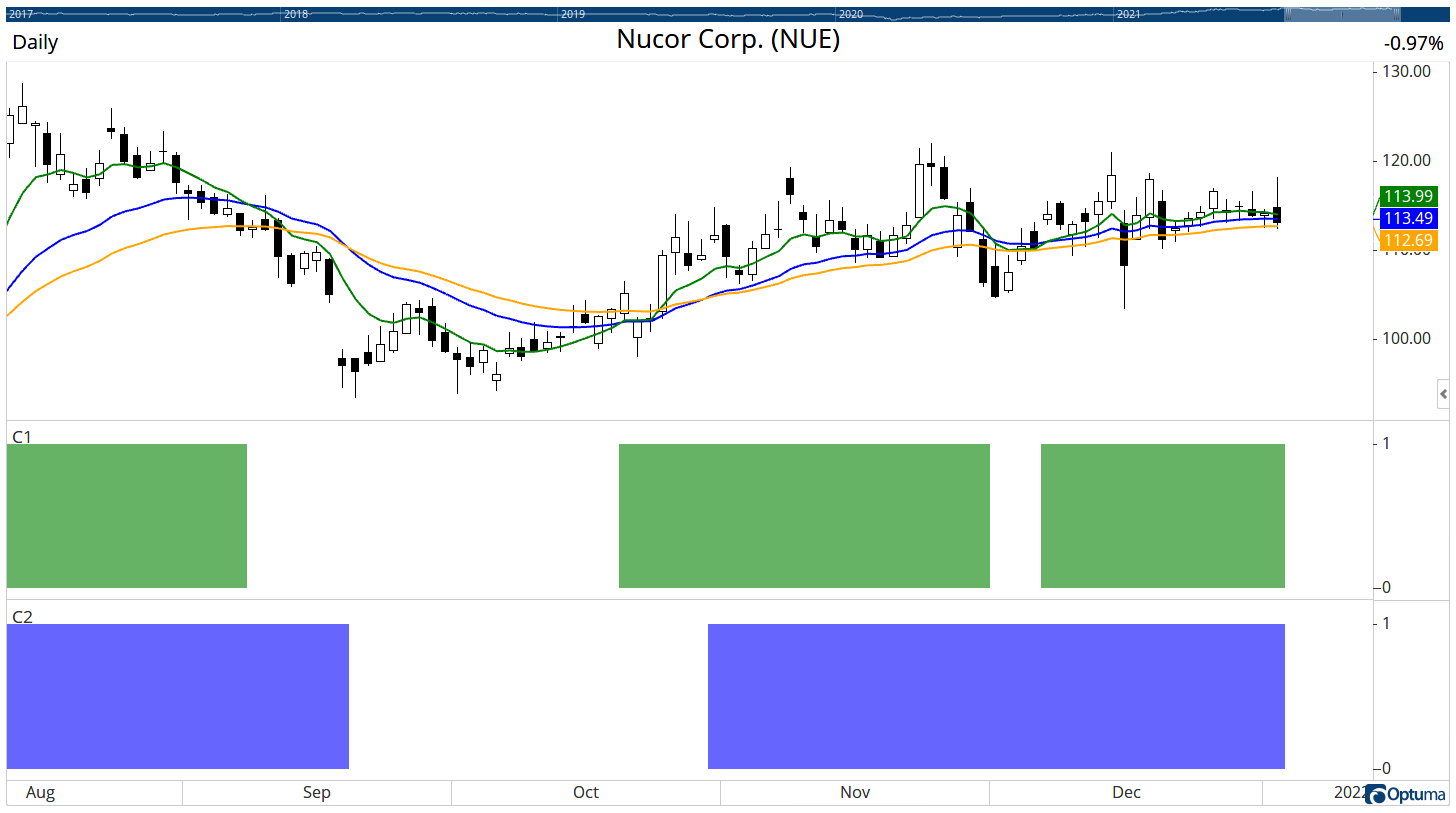
This is a very simple script - but it’s giving errant results. By “errant”, what I mean is that while “most” of the results look right, with the 8EMA>21EMA>34EMA>55EMA>89EMA , approx 10-20% of the results are wrong, i.e. the 34EMA might be above the 21EMA or the 55EMA might be above the 34EMA, etc.

Can someone shed some light on what I’m doing wrong?

I tried it multiple ways, including like this (which I think is the best way):

// 8EMA > 21EMA
c1 = MA(Bars=8, STYLE=Exponential, CALC=Close) > MA(Bars=21, STYLE=Exponential, CALC=Close);

// 34EMA > 55EMA
c2 = MA(Bars=34, STYLE=Exponential, CALC=Close) > MA(Bars=55, STYLE=Exponential, CALC=Close);

// 55EMA > 89EMA
c3 = MA(Bars=55, STYLE=Exponential, CALC=Close) > MA(Bars=89, STYLE=Exponential, CALC=Close);

c4 = c1 and c2 and c3;

// 50MA>200MA
c5 = MA(Bars=50, CALC=Close) > MA(Bars=200, CALC=Close);

c4 and c5

==============================================================
I also tried it like this …

// 89EMA<55EMA<34EMA<21EMA<8EMA
c1 = MA(Bars=89, STYLE=Exponential, CALC=Close) < MA(Bars=55, STYLE=Exponential, CALC=Close) < MA(Bars=34, STYLE=Exponential, CALC=Close) < MA(Bars=21, STYLE=Exponential, CALC=Close) < MA(Bars=8, STYLE=Exponential, CALC=Close);

// 200MA<50MA
c2 = MA(Bars=200, CALC=Close) < MA(Bars=50, CALC=Close);

c1 and c2

===========================================================================================
And I even tried it this, although this way gave zero results. The first 2 ways were better:

// 8EMA>21EMA>34EMA>55EMA>89EMA
c1 = MA(Bars=8, STYLE=Exponential, CALC=Close) > MA(Bars=21, STYLE=Exponential, CALC=Close) > MA(Bars=34, STYLE=Exponential, CALC=Close) > MA(Bars=55, STYLE=Exponential, CALC=Close) > MA(Bars=89, STYLE=Exponential, CALC=Close);

// 50MA>200MA
c2 = MA(Bars=50, CALC=Close) > MA(Bars=200, CALC=Close);

c1 and c2


ScanSettings.png

I found some errors in my above scripts so this is my revised script (ignore the ones above). The script below is still producing some errant results, for example the scan identified the stock “NUE” today as having met the criteria, yet the 21 EMA on that chart is above the 8 EMA (so it should not have come up in the results), but this script is performing better, producing about 90%+ accurate results.

Can someone tell me where I’m going wrong on this one:

// 8EMA > 21EMA
c1 = MA(Bars=8, STYLE=Exponential, CALC=Close) > MA(Bars=21, STYLE=Exponential, CALC=Close);

// 21EMA > 34EMA
c2 = MA(Bars=21, STYLE=Exponential, CALC=Close) > MA(Bars=34, STYLE=Exponential, CALC=Close);

// 34EMA > 55EMA
c3 = MA(Bars=34, STYLE=Exponential, CALC=Close) > MA(Bars=55, STYLE=Exponential, CALC=Close);

// 55EMA > 89EMA
c4 = MA(Bars=55, STYLE=Exponential, CALC=Close) > MA(Bars=89, STYLE=Exponential, CALC=Close);

c5 = c1 and c2 and c3 and c4;

// 50MA>200MA
c6 = MA(Bars=50, CALC=Close) > MA(Bars=200, CALC=Close);

c5 and c6

ScanSettings-1.png

Hi Mark,

When comparing the results make sure that the tool settings on the chart match the scan formula and timeframe. For NUE when I put the 8EMA based on the closing prices (113.99, in green) on a daily chart it is above the 21EMA (113.49, blue), which is above the 34EMA (112.69, orange).

To further verify scan formulas you can use a Show View for each of the scan components so that you can see where each one is true. Here’s the separate results of C1 and C2 from your formula, and you can see both are true:

Capture

Hope that helps!

PS: when submitting script formulas please use the <>CODE box above to format the text as described here: https://forum.optuma.com/topic/how-to-add-code-samples-to-forum-posts/

Thank you. That helped a lot. Once I fixed the tool setting on the chart that didn’t match, the results appear to be correct.