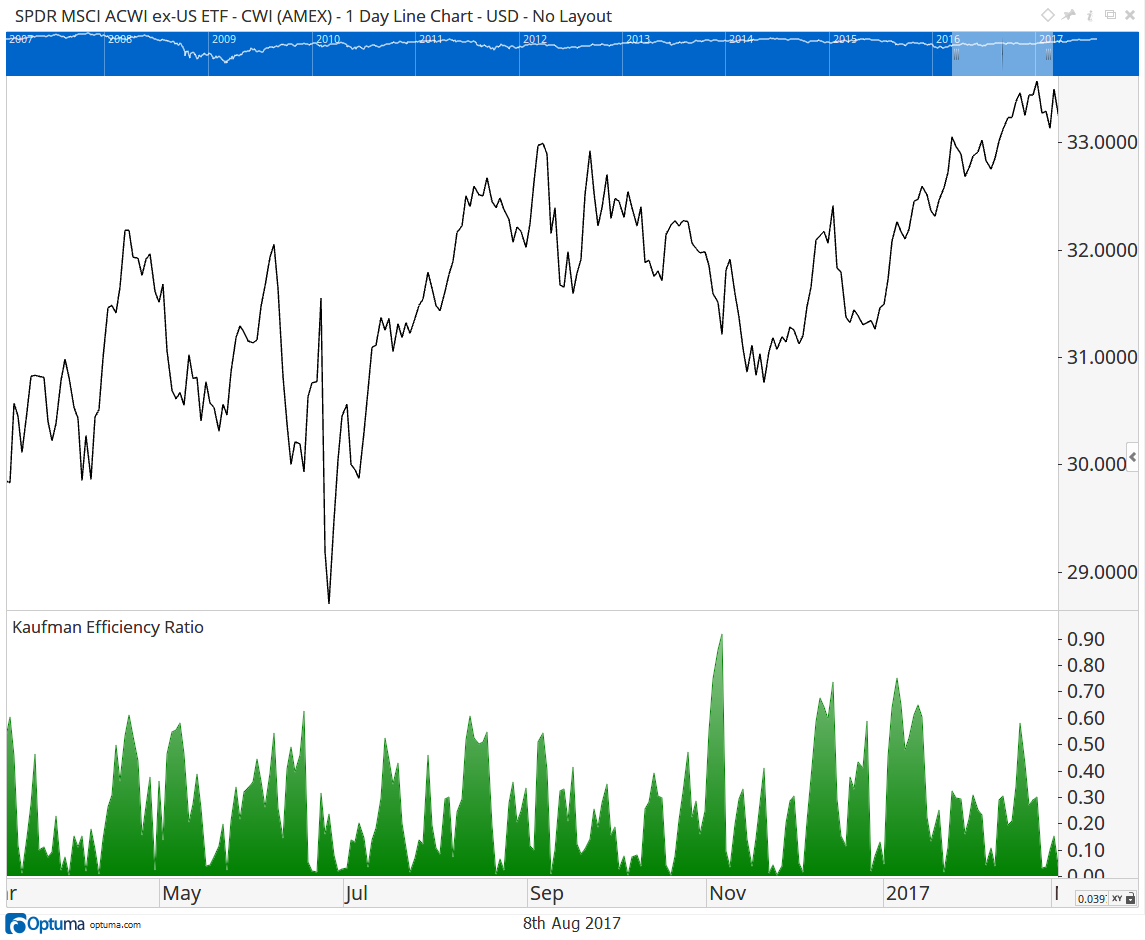
Perry Kaufman developed this indicator to measure the efficiency of a move in the market.
ER = Direction / Volatility
If the move was in one direction and there was little volatility, then the value would be 1. If there was a lot of volatility, then the denominator would be bigger and the ER would be closer to 0. Changes in trend are unlikely to happen when the ER is high.
Hi Optuma
Thanks Optuma for providing this ER script. I’d like to investigate this further but I’d like to use the KER as a show bar and an indicator under the chart like Mathew’s above, but I’d like to be able to script it to show on a +100/-100 scale with +100 representing positive (1) efficiency and -100 representing negative (-1) efficiency, rather than Mathew’s +1/-1 scale. Additionally, I’d also like to adapt Mathew’s script to only identify stocks which have an efficiency ratio above 0.20 (20 on my adapted script). Any help would be appreciated.
The easy way to change the scale would be to apply a ratio. Your 0 level would be at 0.5 on my version so we subtract 0.5 from the result and then apply a ratio to get it to 100. Note the bottom 2 lines.
Hi Mathew
Thank you for the ratio details to change the Efficiency ratio scale, can you also please assist me with the scripting which would only identify stocks where efficiency ratio is above 20.
Hi Optuma
I have attempted to create a script (below) to identify stocks where the efficiency ratio is above 20, but for some reason it generates 0 results, can you tell me where I might be going wrong please?
Efficiency ratio calc as per your script, saved as a script named ‘EfficiencyRatio20’
vol1 = CHANGE(INT_COUNT=1);
vol2= ABS(vol1 );
vol3 = ACC(vol2, RANGE=Look Back Period, BARS=20);
dir1 = CHANGE(INT_COUNT=20);
dir2 = ABS(dir1);
r1 = (dir2 / vol3) - 0.5;
r1 / 0.5 * 100
Script using saved script ‘EfficiencyRatio20’ to identify stocks where Efficiency ratio is above 20
V1 = Script(EfficiencyRatio20);
V2 = V1() > 20;
V1 == 1 and V1[1] == 1 and V2 == 1