Hi there, I am writing a show me and want to reference a value on a particular bar when a certain date is met via a calculation. I want to then use this same value on every bar from this point. However, the value keeps changing as each new bar is encountered, and does not keep the original value that was set, is there a way to carry values forward and prevent them from changing with each new bar?
Hi Mario,
The best way to do this would be using the VALUEWHEN() function and the FIRST() function.
The following is a general example of how it can be used:
//Set Moving Averages
V1 = MA(BARS=25);
V2 = MA(BARS=50) ;
//Find MA Cross Over
V3 = V1 CrossesBelow V2 ;
//Set RSI Value
V4 = RSI() ;
//Find Value of RSI with MA Cross Occurs
V5 = VALUEWHEN(V4,V3);
//Set the script to show the RSI value at the first MA Crossover on the chart then set as a static value
FIRST(NONZERO(V5))
The above script would set the indicator value to the RSI’s value when the first Moving Average crossover occurred and it would not change.
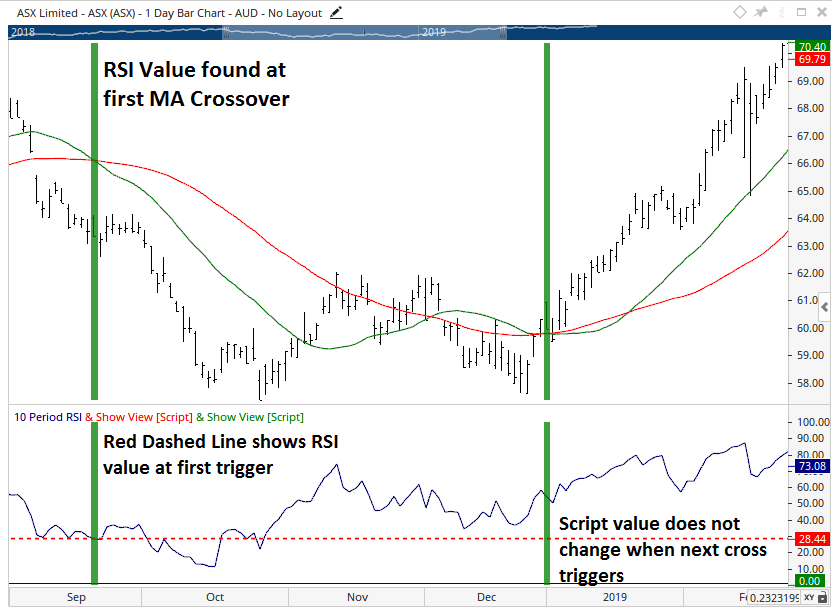
Red Dashed line is produced from the example script listed above.
Great, thanks Matthew, perfect I will attempt to apply the first function, is it also possible to assign a variable several values.
For example
a1 = 5
a2 = 7
a3 = 8
b1 = a1 or a2 or a3;
plot0 = b1;
I saw the possibility to use #a1 to pass variables, but not sure what the difference is between #a1 or just declaring a1, and also not sure on how to assign the same variable to several values. I am currently using:
plot0 = a1
plot1 = a2
plot2 = a3 ect, but I run out of plots by the time I get to plot13 :)
Hi,
A variable can only display one value at a time, but you can swap between which value is being plotted using an IF() function.
For example:
V1 = MA(BARS=20) ;
V2 = MA(BARS=50) ;
plot1 = IF(V1 > V2,V1,V2)
In this example the plot would swap between the V1 and V2 values based on the rule specified (V1 being greater than V2). This is how it looks on a chart…
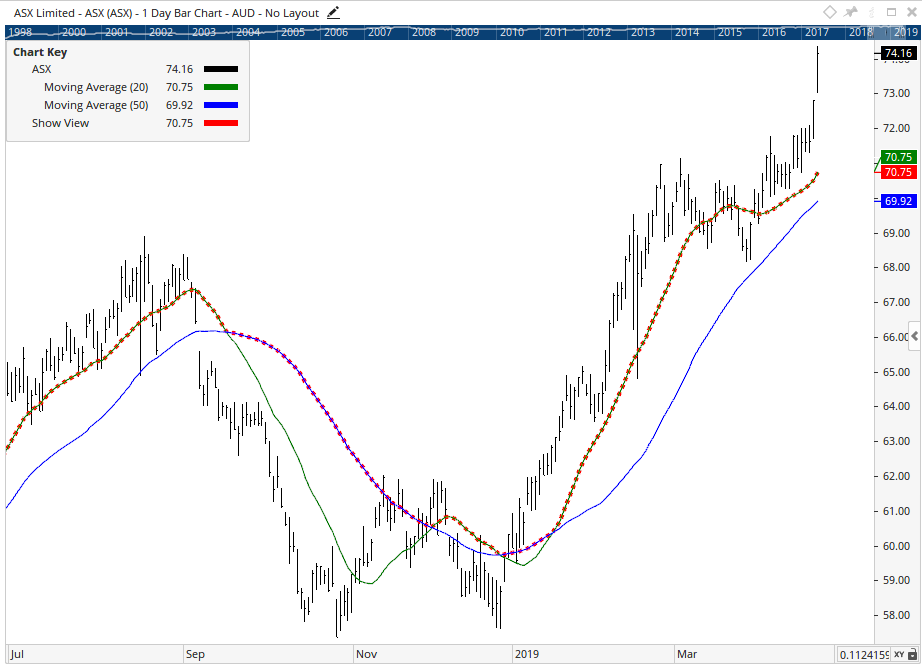
You can see the red dashed line (script) swaps between following the 20SMA and 50SMA.
Hi Mathew,
Thank you, is there a way I can assign several values, there are 20+ values I would like to plot, or is the only way to do nested if statements ?
Many thanks
Mario
Scripts support plot1, plot2, etc to show multiple values. If you are wanting Plot1 to show several different values (not at the same time but swapping between them on a bar by bar basis), the only way is to use IF() / nested IF() where rules are outlined on which of the multiple values should be displayed and when.